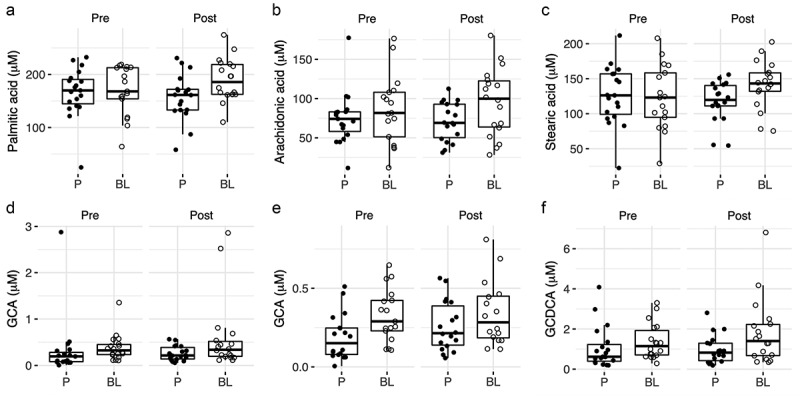
Figure 3.

Overview of changes in plasma fatty acids and bile acids.
Concentrations of metabolites in plasma at baseline (V1) and end of intervention (V2) per group: A) palmitic acid, B) arachidonic acid, C), stearic acid, D) glycine conjugated cholic acid (GCA), E) glycine conjugated cholic acid (GCA) without outliers, F) glycine-conjugated chenodeoxy cholic acid (GCDCA). BL NCC3001 (BL, open circle); Placebo (P, closed circle).
