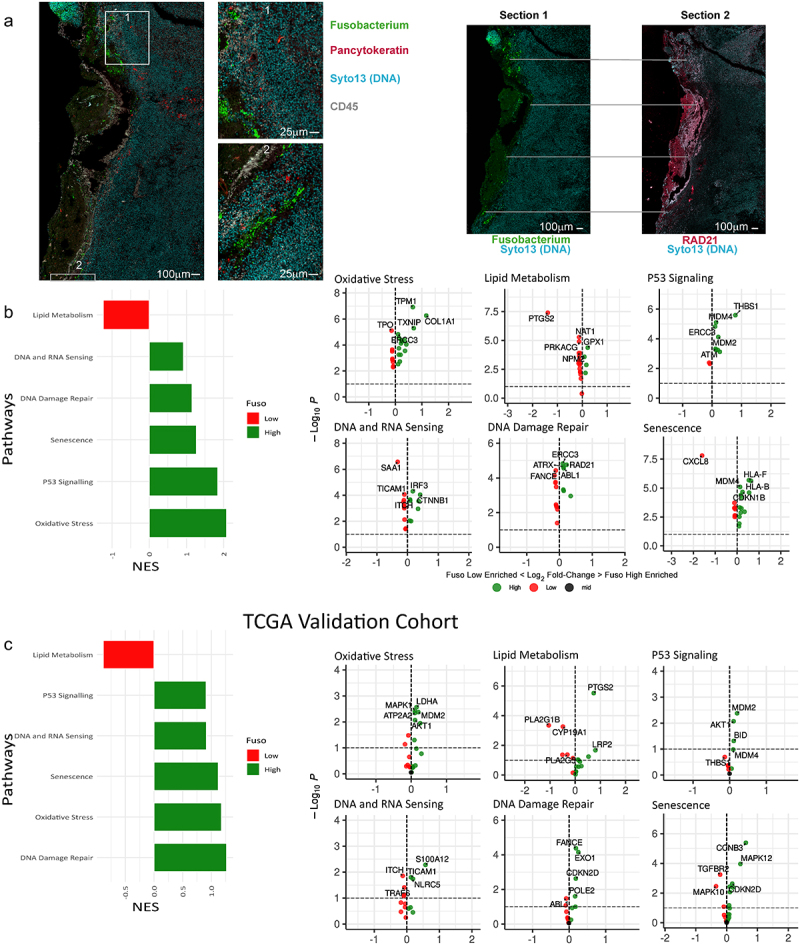
Figure 3.

(a) Imaging of mucinous sample with GeoMx. Left: image of a tissue section showing fuso bacteria with insets (middle left) showing the localization of fusobacteria in higher magnification. On the right fusobacterial staining is shown together with RAD21 staining of a subsequent section of the same tissue highlighting examples of the close localization of fusobacterial and RAD21 staining with gray lines. (b) GSEA showing DNA damage and repair associated signaling pathways, that are differentially regulated in high versus low fusobacterial regions. A high normalized enrichment score (NES) indicates an overrepresentation of the genes in the fusobacterial high ROIs, and a low NES indicates an overrepresentation of the genes in the fusobacteria low samples. (c) TCGA validation cohort, which includes 594 patients with CRC (non-mucinous; n = 522, mucinous; n = 72). The 75th percentile of the fusobacteria load is used as a cutoff and the upper (75th) percentile indicates the “fuso high” and the lower percentiles mark the “fuso low”.
