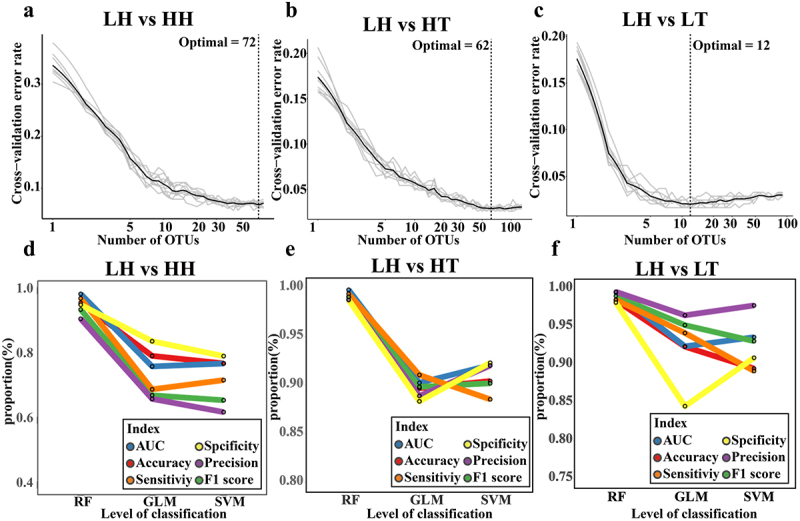
Figure 3.

Identification of gut microbiota biomarkers in plateau population.
(a – c) The optimal number of gut microbiota biomarkers for LH_vs_HH (a), LH_vs_HT (b), and LH_vs_LT (c) were determined by random forest. (d – f) The performance of RF, GLM, and SVM classification models constructed by LH_vs_HH (d), LH_vs_HT (e), and LH_vs_LT (f) using the gut microbiota biomarkers, respectively. Blue, red, orange, yellow, purple, and green represent AUC, Accuracy, Sensitivity, Specificity, Precision, and F1 Score, respectively.
