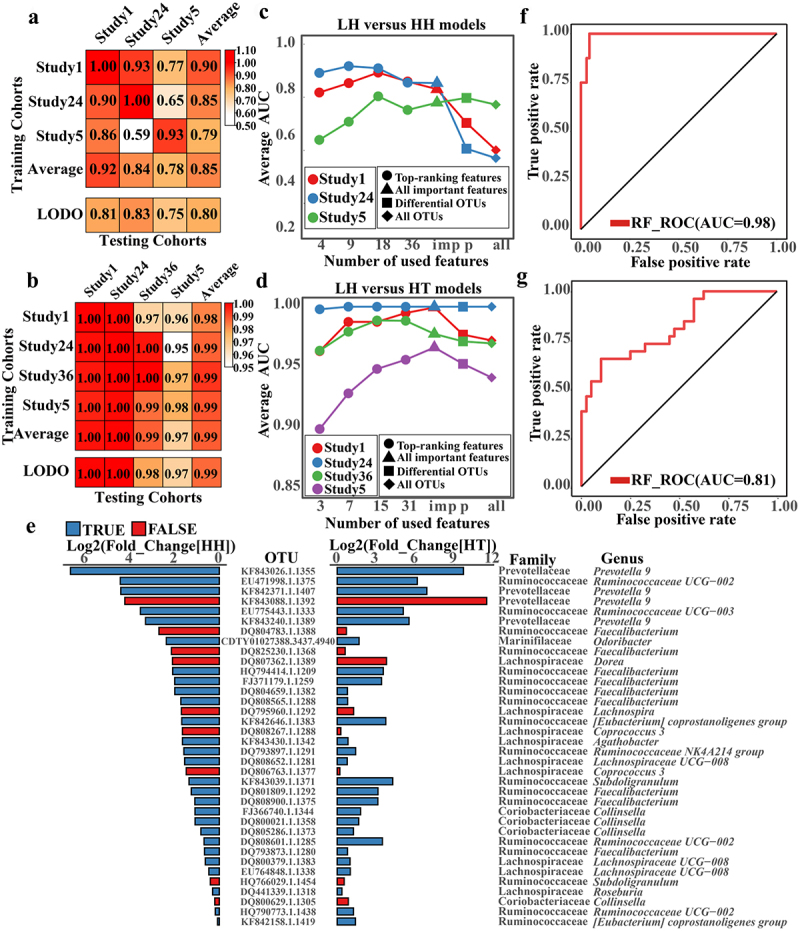
Figure 4.

Validation of predictive performance of gut microbiota biomarkers in plateau population.
(a,b) Cross-validation matrices of LH_vs_HH (a) and LH_vs_HT (b), respectively. The model was constructed using the RF method with 10-fold cross-validation. The value represents the AUC, and the color depth was positively correlated with the AUC. The top squares represent the result of study-to-study transfer validation, and the bottom squares represent the result of LODO validation. The training and test samples are marked on the left and top, respectively. All samples except for test samples were used as training samples in LODO validation. (c,d) AUC value of LH vs HH (c) and LH vs HT (d) LODO validation classifiers with different characteristics. Circles, triangles, squares and diamonds represent top-ranking biomarkers, all biomarkers, all significantly different OTUs and all OTUs, respectively. The color of the line represents the test set sample. The Wilcoxon Rank sum test calculated the significant difference in OTUs (FDR-corrected p value < 0.05). (e) The gut microbiota co-biomarkers of high-altitude population. Fold change is equal to the ratio of the average relative abundance of OTU in HH or HT to the average relative abundance of OTU corresponding to LH. The length of the bar graph is log2 (fold change). The blue bar indicates a significant difference between LH and LT (FDR-corrected p value < 0.05), and the red indicates a non-significant difference between LH and LT. (f) ROC curves of LH_vs_HA(High Altitude[HH and HT]). 20% of the total samples were randomly selected as the test set, and the remaining samples were used as the training set, repeated ten times. Only the optimal ROC curve and average AUC values are shown here. (g) A set of newly collected samples (LH, n = 26; HA, n = 40) was used as a test set to verify the model constructed with LH and HA samples as the training set.
