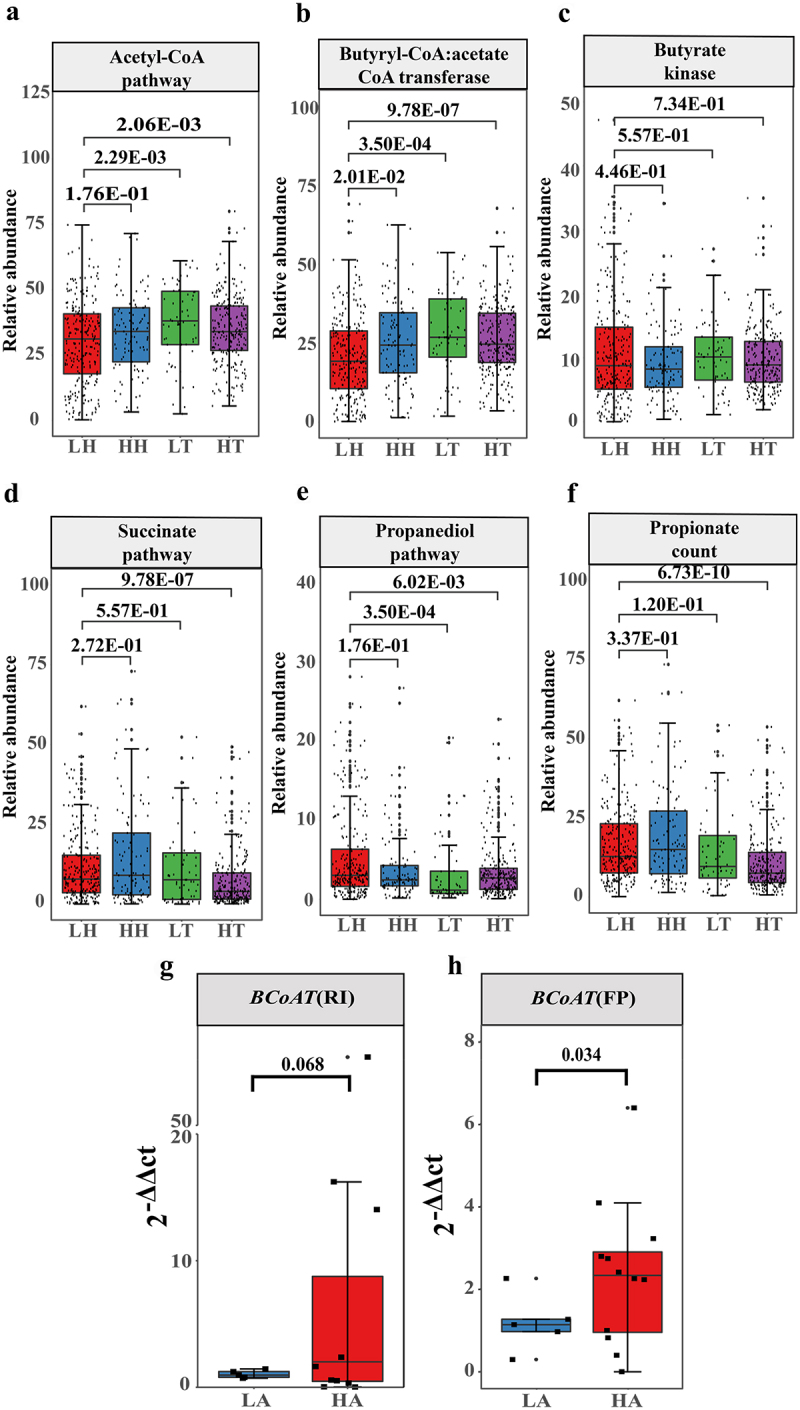
Figure 6.

Changes in the abundance of gut microbiome SCFA-producing bacteria in high- and low-altitude population.
(a) Prediction of the abundance of butyrate-producing bacteria by acetyl-CoA pathway. (b) Prediction of the bacterial abundance of butyryl-CoA: acetate CoA transferase. (c) Prediction of the bacterial abundance of Butyrate kinase. (d) Prediction of the abundance of propionate-producing bacteria by succinate pathway. (e) Prediction of the abundance of propionate-producing bacteria by propanediol pathway. (f) Prediction of the abundance of total propionate-producing bacteria. (c) – (f) FDR-corrected p value was from the Wilcoxon Rank sum test. (g,h) qPCR results. The difference between the abundance of BCoAT in LH (n = 5) and HA (n = 12) is shown in (g) BCoAT primers designed according to R. intestinalis. (h) BCoAT primers designed according to F.prausnizii. The 2−ΔΔCT denotes the abundance. p values were obtained from a one-sided t-test.
