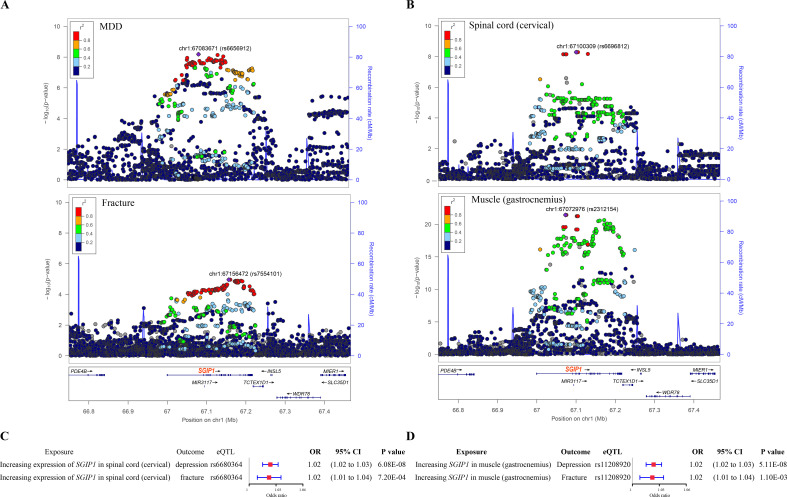
Figure 4.
The distinct signal (SGIP1) shared by MDD and fracture. (A) The regional plot of the association between MDD and fracture. The x axis is the position at chr1: 66749044–67466822 (hg19). Each dot represents a genetic variant within this region. The upper panel shows the association of genetic variants with MDD, with the most significant SNP rs6656912 shown in purple diamond. The lower panel shows the association of genetic variants with fracture, with the most significant SNP rs7554101 shown in purple diamond. (B) The regional plot of the association of SGIP1 gene expression in the spinal cord (cervical) and muscle (gastrocnemius). The upper panel shows the association of SGIP1 gene expression in the spinal cord (cervical), with the most significant SGIP1 eQTL rs6696812 shown in purple diamond. The lower panel shows the association of SGIP1 gene expression in muscle (gastrocnemius), with the most significant SGIP1 eQTL rs2312154 shown in purple diamond. (C) The association of genetically predicted SGIP1 gene expression with MDD and fracture risk in spinal cord (cervical). (D) The association of genetically predicted SGIP1 gene expression with MDD and fracture risk in muscle (gastrocnemius). eQTL, expression quantitative trait loci; MDD, major depressive disorder; SNP, single nucleotide polymorphism.

