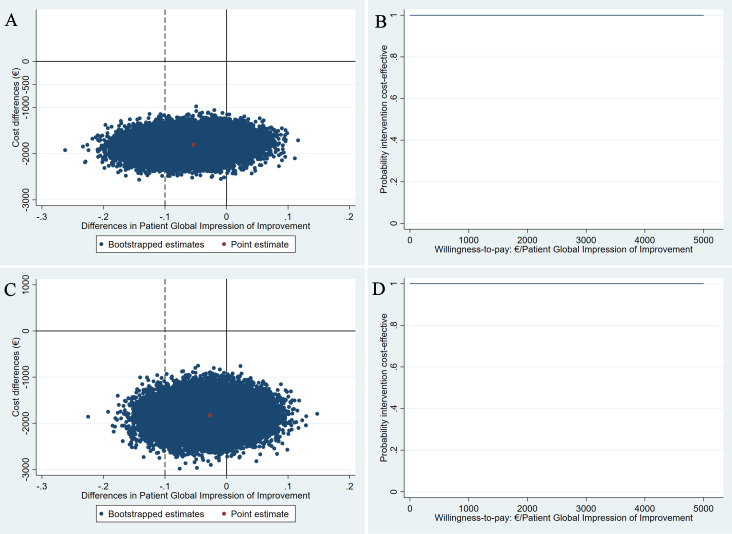
Figure 1.
Cost-effectiveness planes (CE-planes) and cost-effectiveness acceptability curves (CEACs) for Patient Global Impression of Improvement (PGI-I). CE-planes (A,B) and CEACs (C,D) comparing pessary therapy with surgery for the PGI-I outcome from a healthcare and a societal perspective, respectively. CE-planes show the incremental cost-effectiveness ratio point estimate (red dot) and the distribution of the 5000 replications of the bootstrapped cost–effect pairs (blue dots). CEACs indicate the probability of pessary therapy being cost-effective compared with surgery (y-axis) for different willingness-to-pay (WTP) thresholds per unit of PGI-I gained (x-axis). The dashed line represents the non-inferiority margin of 10%. (A and C) All of bootstrapped cost–effect pairs were distributed in the southern quadrants of the CE-planes, meaning that the pessary therapy is less costly but could also be less and more effective. 83.2% bootstrapped cost–effect pairs are situated on the right of the non-inferiority margin for effects. (B and D) A steady probability of 1 that the pessary therapy is cost-effective compared with surgery for different WTP thresholds per PGI-I gained. PGI-I is presented as the difference between groups in the proportion of participants reporting improvement.

