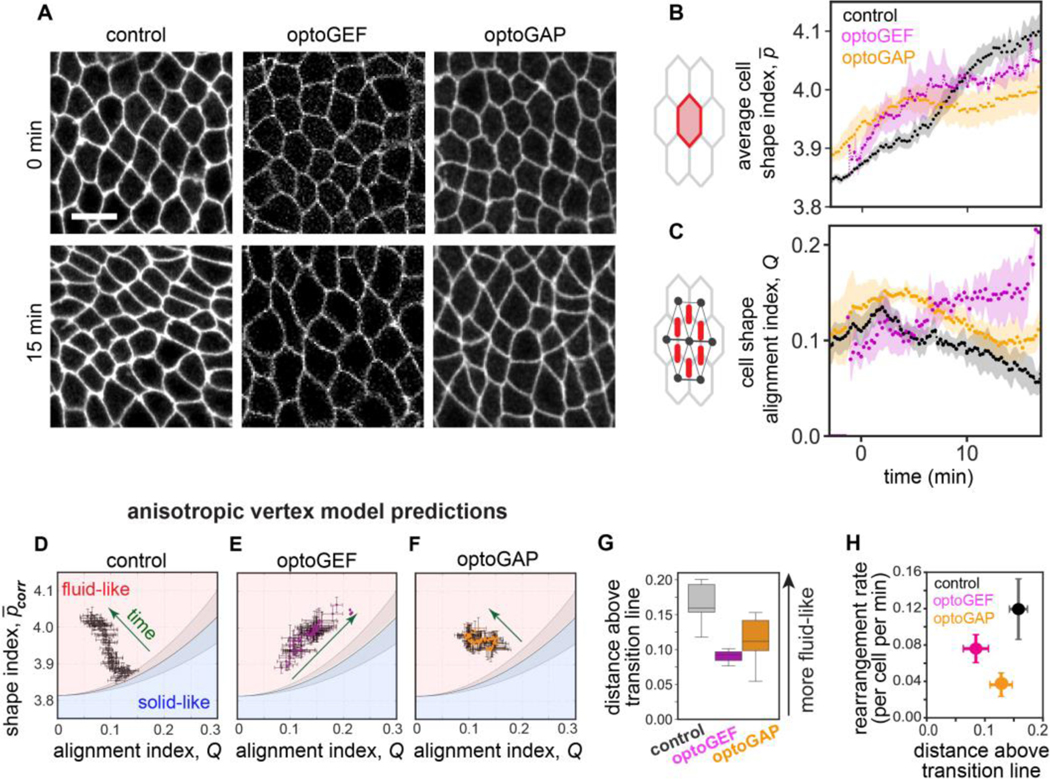
Figure 2.
Cell packings and tissue mechanics in optogenetically manipulated germband tissue. (A) Stills from confocal movies showing cell packings during axis elongation. Anterior, left. Ventral, down. Bar, 10 μm. See also Movies S1–3 in Supplemental Material [37]. (B) The average cell shape index during convergent extension in photoactivated control, optoGEF, and optoGAP embryos. The mean ± SEM between embryos is shown, n=3–5 embryos per genotype. (C) The cell shape alignment index during convergent extension in photoactivated control, optoGEF, and optoGAP embryos. The mean ± SEM between embryos is shown, n=3–5 embryos per genotype. (D-F) Relationship between the corrected averaged cell shape index and cell shape alignment in the germband for control (D), optoGEF (E), and optoGAP (F) embryos. The corrected cell shape index and cell shape alignment can be used to predict tissue mechanical behavior using an anisotropic vertex model [13]. Each data point represents the mean between embryos at an individual time point, n=3–5 embryos per genotype. Solid line represents the predicted solid-fluid transition line, shaded area represents the range of predicted values for the transition from prior vertex model simulations (see Materials and Methods section). (G) Distance to the predicted solid-fluid transition line, evaluated during the rapid phase of tissue elongation (). (H) Relationship between cell rearrangement rate and predicted solid-fluid properties.

