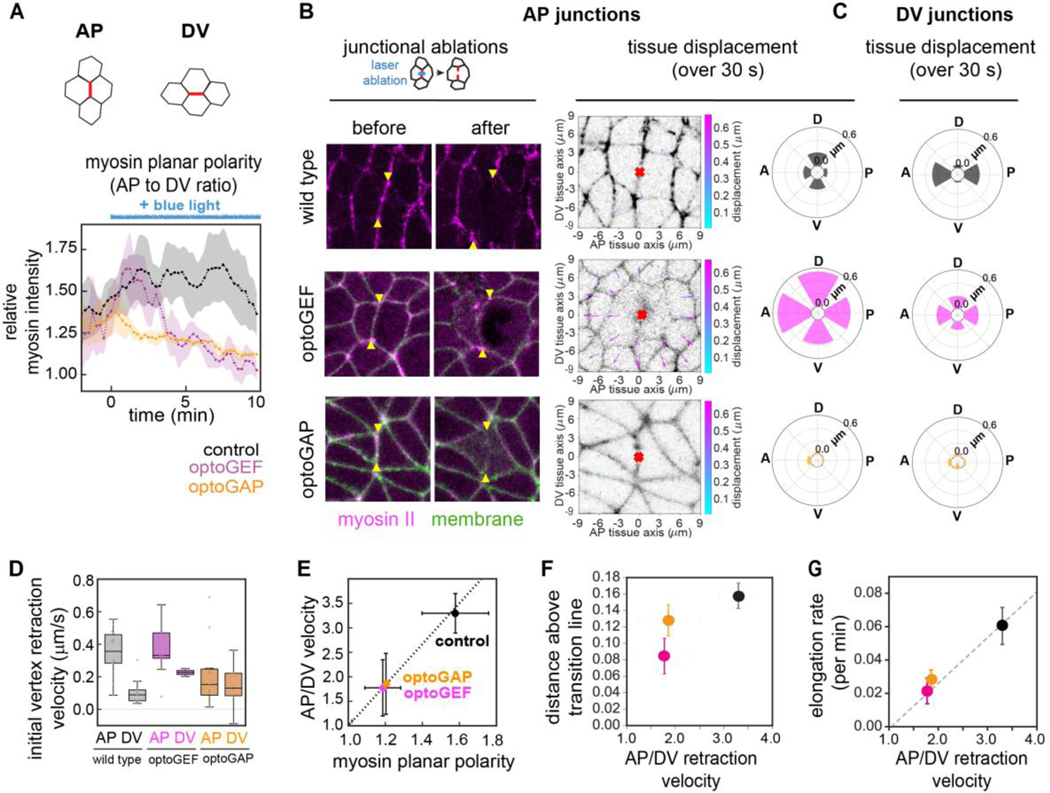
Figure 3.
Patterns of actomyosin-generated tension at cell junctions in optogenetically manipulated germband tissue are linked with tissue fluidity. (A) Ratio of mean myosin intensities at AP compared to at DV junctions before and during tool activation beginning at (duration of blue light exposure indicated by blue line). Ratios for each embryo at each time point were calculated, and the mean ± SEM between embryo is shown. n=3–4 embryos, >10 cells/embryo. See also Movie S4 in Supplemental Material [37]. (B) (left panel) Ablations at AP cell junctions in optogenetically manipulated germband tissue. Cells before (left) and 1 min after (right) ablation. Myosin II (magenta), CIBN-pmGFP (green). Arrowheads indicate the vertices connected to the junction in which the cut was made. Anterior, left. Ventral, down. Image size, 20 × 20 μm. (right panel) Maps of displacements in the surrounding tissue in the 30 s following AP ablations. The tissue in a 174 μm2 region surrounding the ablation point (red mark) was analyzed by PIV analysis following ablation. Radial plots show the mean total displacement after AP ablation, averaged over the regions in 60° angular bins, along the anterior, posterior, dorsal, or ventral tissue axes, n = 3–11 ablations per condition. (C) Radial plots showing the mean total displacement following DV ablations. (D) Initial vertex retraction velocities after ablation. Mean ± SEM between junctions is shown, n=10–15 AP, 3–10 DV junctions per condition. (E) Mechanical anisotropy was reduced in optoGEF and optoGAP embryos and correlates with myosin planar polarity at 5 min after optogenetic activation. Mechanical anisotropy was calculated as the ratio of mean AP to mean DV peak retraction velocities, n = 3–15 edges per condition. (F) Relationship between predicted fluid-solid tissue properties and tension anisotropy. As a readout of anisotropy, the ratio of AP to DV peak retraction velocities after ablation of junctional myosin was used. (G) Relationship between tissue elongation rate and tension anisotropy. Dashed lines, guide to the eye. Photoactivated control embryos (black), optoGEF (magenta), and optoGAP (orange).

