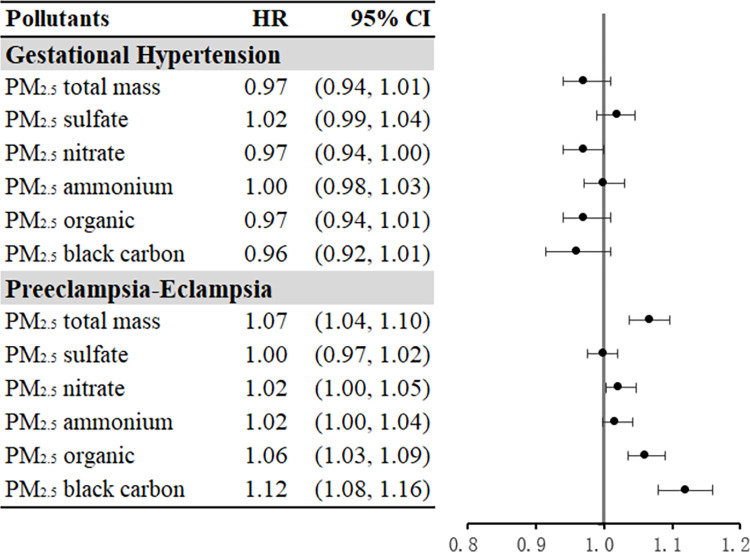
Fig 1. Adjusted HRs and 95% CIs of air pollution during pregnancy associated with GH and PE-E.
HRs and 95% CIs were calculated for per IQR increment for each air pollutant. Model adjusted for maternal age, race/ethnicity, education, block group household income, smoking and passive smoking status during pregnancy, insurance type, season, and year of infant birth. Zip code was fitted as a random effect. CI, confidence interval; GH, gestational hypertension; HR, hazard ratio; IQR, interquartile range; PE-E, preeclampsia-eclampsia.

