Figure 1.

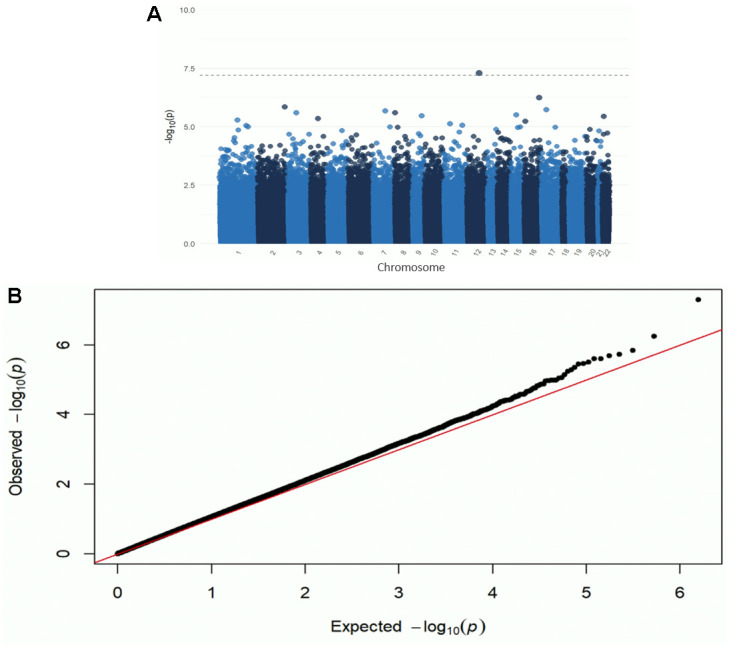
Manhattan (A) and QQ plot (B) from the EWAS of DNAm with the ADI. Adjusted for race, sex, educational attainment, age at death, APOE genotype, cell type, and post-mortem interval. Bonferroni-threshold: 0.05/789889 = 6.33e-8 (λ=0.94).

Manhattan (A) and QQ plot (B) from the EWAS of DNAm with the ADI. Adjusted for race, sex, educational attainment, age at death, APOE genotype, cell type, and post-mortem interval. Bonferroni-threshold: 0.05/789889 = 6.33e-8 (λ=0.94).