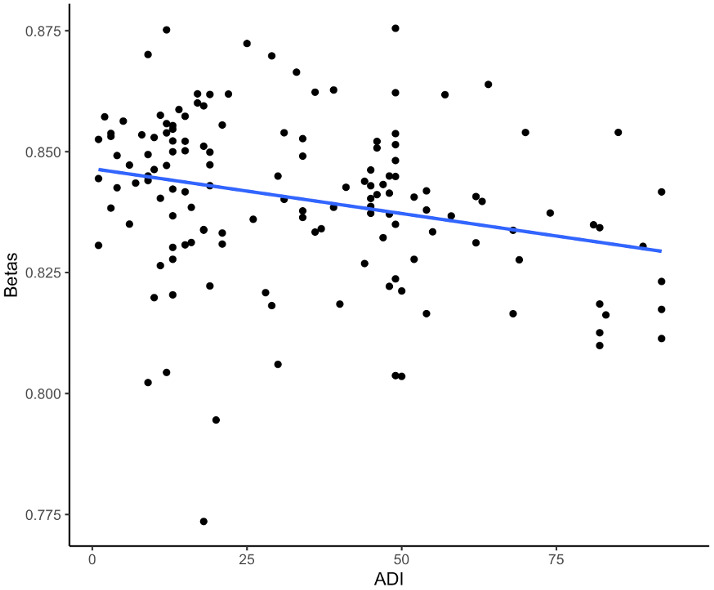
Figure 2.

Scatterplot of DNAm beta values and the ADI from the EWAS of DNAm with the ADI for the CpG site cg26514961 (PLXNC1). The dots represent the DNAm beta and ADI values for a participant, and the blue line represents the (unadjusted) linear relationship between the DNAm beta values and the ADI.
