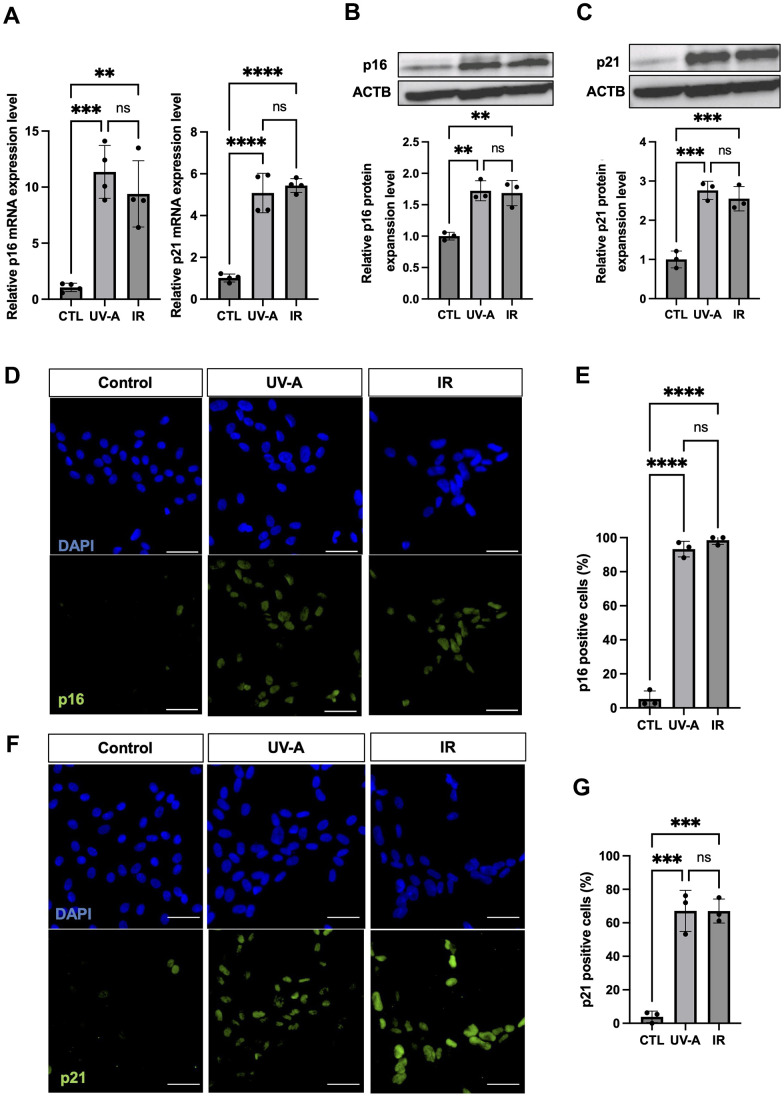
Figure 2.
Characteristics of senescent human corneal endothelial cells. (A) RNA expression analysis by real-time PCR of p16 and p21 in control, UV-A-treated or IR-treated cells from four independent experiments. Gene expression was normalized to the housekeeping gene ACTB. B-C, Protein expression analysis by western blotting and quantification of p16 (B) and p21 (C) in control, UV-A-treated or IR-treated cells from four independent experiments. Results were plotted as mean and standard deviation from three independent experiments. Gene expression was normalized to the housekeeping protein ACTB. D-G, Immunofluorescent staining (D) and quantification (E) of p16 protein expression, and immunofluorescent staining (F) and quantification (G) of p21 protein expression, in hCEnCs treated upon UV-A or IR. Representative images are shown with scale bars indicating 100 μm. Quantification of immunofluorescent staining is presented as the mean percentage of positive cells from three independent experiments. ** = p < 0.01; *** = p < 0.001; **** = p < 0.0001; ns=not significant.

