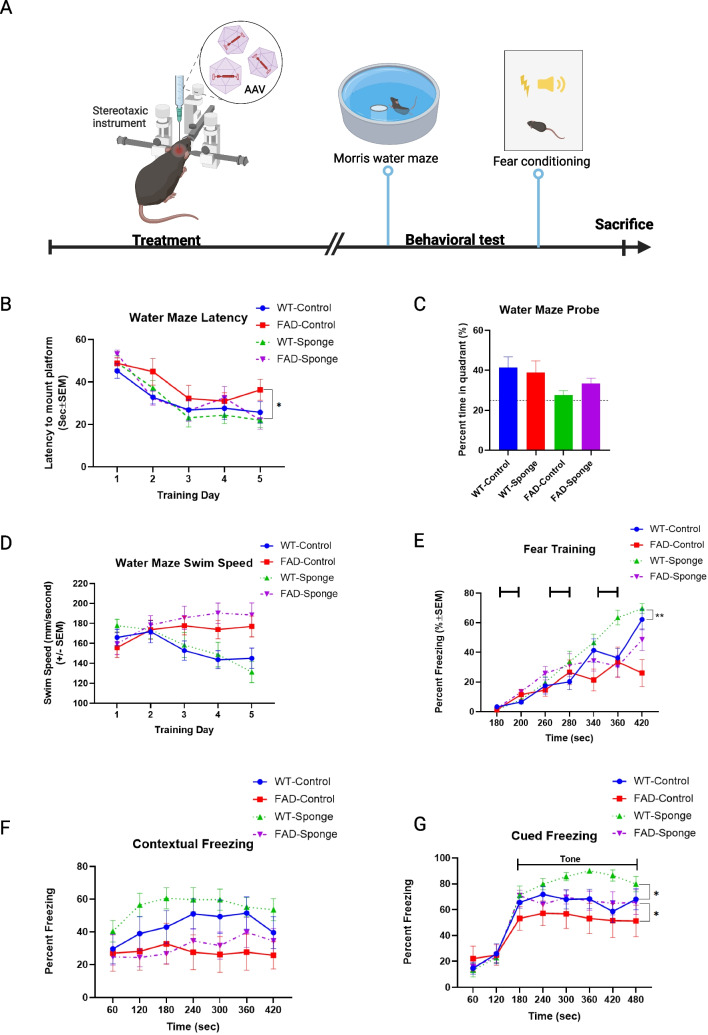
Fig. 2.
Results of Morris water maze and fear conditioning. A Timeline of experiments. B Latency to find the platform. C Water maze probe trial. D Swim speed during 5 days of training trial. E Fear training with 3 tone-shock pairings. F–G Percentage of time spent in freezing following re-exposure to the shock-associated context or tone. Data are mean ± SEM with n = 9–12 per group. Data were analyzed via two-way repeated measures ANOVA (time × group) or three-way repeated measures ANOVA (time × group × genotype). The water maze probe trial was analyzed via two-way ANOVA (genotype by group). *p < 0.05, **p < 0.01 based on post hoc pairwise comparisons

