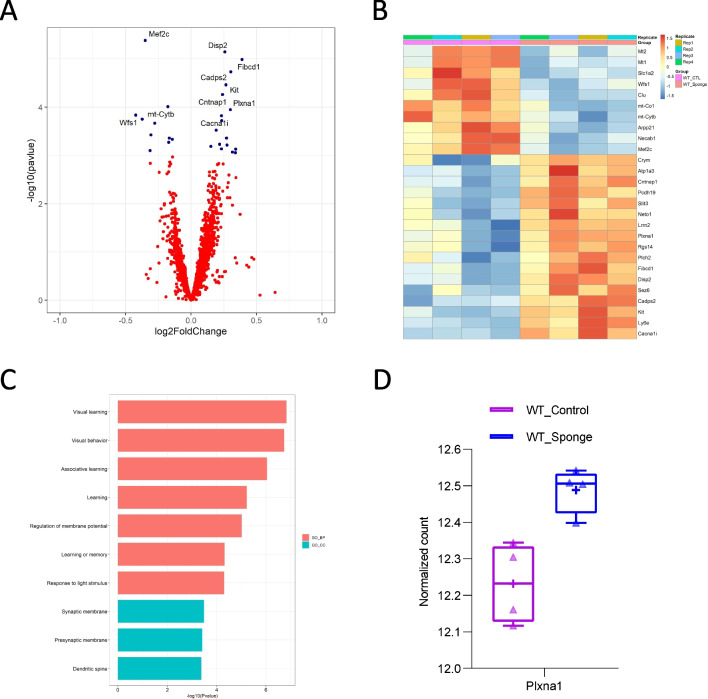
Fig. 5.
Downstream effectors of miR-29a at the transcript level in WT mice. A Volcano plot displaying the distribution of differentially expressed genes between WT-Sponge and WT-Control. Top 10 DEGs were labeled. B Heatmap of DEGs between WT-Sponge and WT-Control. Downregulated DEGs in WT-Sponge vs WT-Control were depicted in blue and upregulated DEGs were in orange. C GO enrichment analysis of upregulated DEGs in WT-Sponge. D Expression of DEG that is the predicted target of miR-29a

