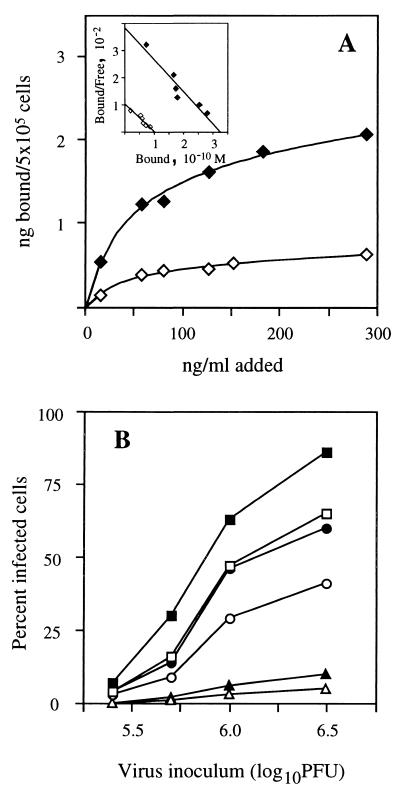
FIG. 4.
Comparison of J774 and J774E cells for MR expression and susceptibility to influenza virus infection. (A) Binding of 125I-mBSA to J774 (◊) and J774E (⧫). Scatchard plots of the data (inset) yielded Kd values of 10 and 11.5 nM for J774 and J774E cells, respectively. For these calculations, the molecular mass of mBSA (31 mol of mannose per mol of BSA) was taken to be 73,000 kDa. (B) Infection of J774 (open symbols) and J774E (solid symbols) by BJx109 (□, ■), HKx31 (○, ●), and PR8 (▵, ▴). The greater susceptibility of J774E cells to influenza virus infection was observed in multiple experiments.

