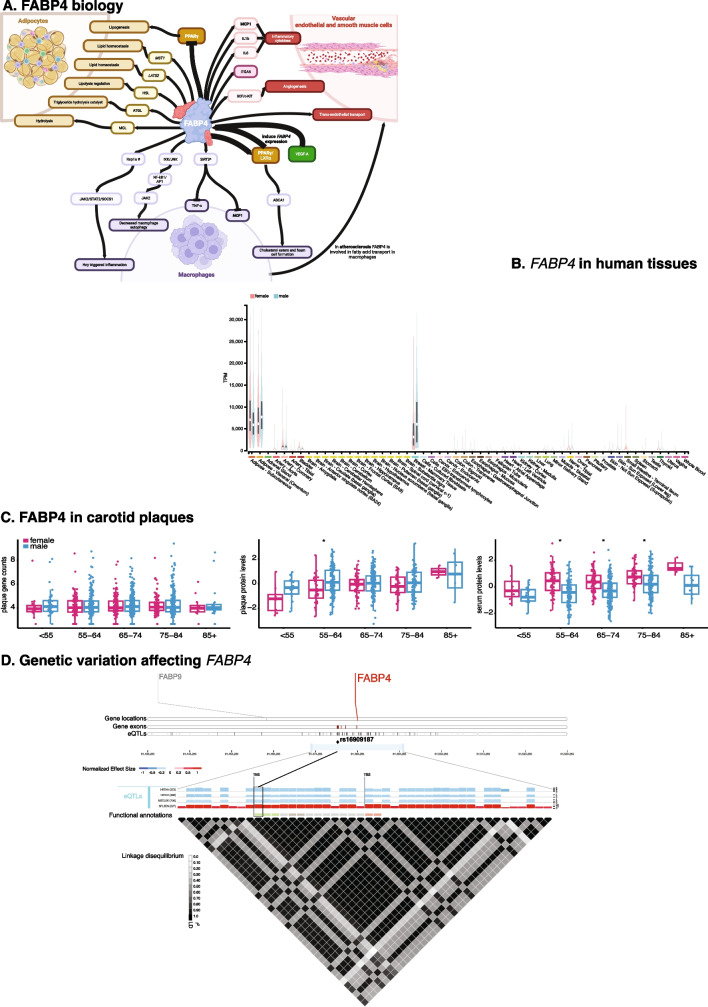
Fig. 1.
FABP4 in human tissues. A Schematic representation of FABP4 interactions in adipocytes, vascular endothelial cells and smooth muscle cells, and macrophages. PPARγ: peroxisome proliferator-activated receptor gamma; MST1: Mammalian sterile 20-like protein 1; LATS2: large tumor suppressors 1; HSL:Hormone sensitive lipase; ATGL: adipose triglyceride lipase; MGL: monoacylglycerol lipase; MCP1: monocyte chemoattractant protein-1; IL-1b: interleukin 1b; IL6: interleukin 6; ITGA5: integrin subunit alpha 5; VEGF: vascular endothelial growth factor; LXRα: liver X receptor alpha; ABCA1: ATP-binding cassette A1; IKK: IκB kinase; JNK: c-Jun N-terminal kinase; NFkB1: nuclear factor kappa B; AP1: activator protein 1; SIRT3: sirtuin 3; TNFα: tumor necrosis factor alpha; Rap1a: Ras-related protein 1a; JAK2: Janus kinase 2; STAT2: signal transducer and activator of transcription 2; SOCS1: suppressor of cytokine signaling 1; Hcy: homocysteine. Tumor necrosis factor α (TNF-α) and monocyte chemoattractant protein-1 (MCP1) are inflammatory cytokines. Bold letters indicate proteins present in more than one cell type. * = in FABP4-deficient macrophages; # = Hcy treated [12•, 19]. B The FABP4 gene expression in different human tissues stratified by sex. Data were taken from GTEx Portal (http://www.gtexportal.org/) on 2023–10-10 [113]. FABP4 is mostly expressed in adipose and mammary tissues and shows low expression in the circulation. C FABP4 gene expression and FABP4 protein levels in carotid plaques (upper and middle panel), and FABP4 protein levels in serum (lower panel) per age stratum and stratified by gender. No differences are observed for FABP4 expression in carotid plaques per age stratum and gender. Both plaque and serum FABP4 levels rise by age group. However, plaques-derived FABP4 levels are higher in men, whereas serum-derived FABP4 levels are higher in women. Data from the Athero-Express Biobank Study [52, 111, 112], see Methods. D Expression quantitative trait loci (eQTLs) for FABP4 gene expression in human tissues. In this 2000-Kb genomic region on chromosome 8, the FABP4 gene is marked in red. The 4 bars under the gene names show the gene locations, the FABP4 gene exons, and the eQTLs for FABP4. The middle panel shows the normalized expression effects (NES) for eQTLs per tissue, blue is a negative NES, red is a positive NES. The functional annotations are light red) promotor flanking regions, light grey) intronic variant, dark gray) non-coding transcript exon variant, and green) 3′ UTR variant. HRTAA: atrial appendage in the heart; HRTLV: left ventricle in the heart; MSCLSK: skeletal muscle; SPLEEN: spleen; TES: transcription end site; TSS: transcription start site. The yellow diamond and line demarcate rs16909187 at chr_81478482 (b38) with non-effect allele G and effect allele A. The A-allele is associated with lower FABP4 gene expression HRTAA, HRTLV, and MSCLSK, whereas the same allele is associated with higher FABP4 expression in SPLEEN and higher serum FABP4 levels [77••]. The bottom panel shows all the variants, i.e., eQTLs, affecting FABP4 gene expression and the linkage disequilibrium plot.

