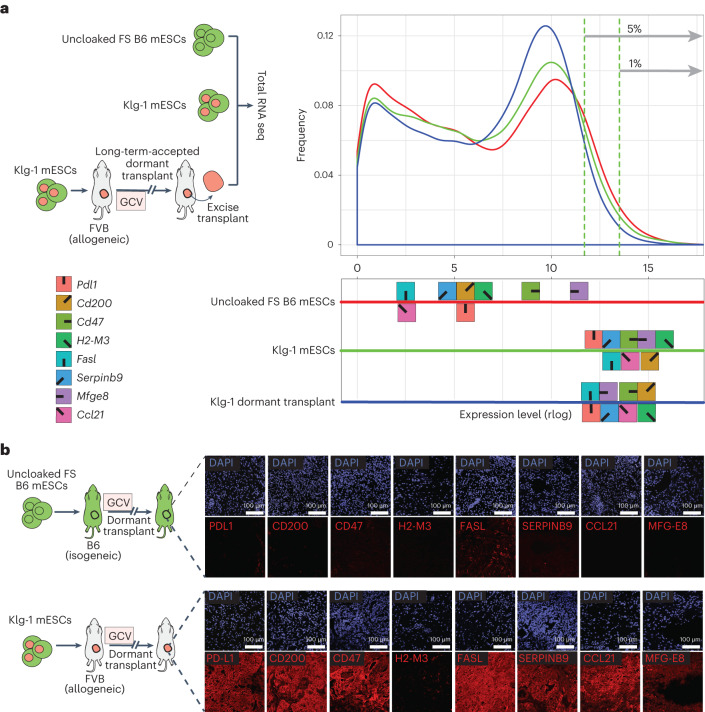
Fig. 3. Klg-1 cloaking transgenes within the gene expression profile.
a, Left: experimental schema showing collection of RNA for whole-genome RNA-seq expression analysis, from uncloaked FS and Klg-1 mESCs, as well as cells isolated from a Klg-1-derived dormant teratoma in allogeneic FVB recipients. Right: gene expression level distribution in uncloaked FS (red), Klg-1 (green) mESCs and a Klg-1 teratoma (blue), with plot showing the proportion of genes (y axis) at a given expression level (x axis). The symbols with corresponding colours show the cloaking gene expression levels in the distributions. Vertical green dotted lines show 95–99% highest expression range. b, Antibody staining of immune factors in long-term-accepted teratomas derived in isogeneic (top) and allogeneic (bottom) settings.

