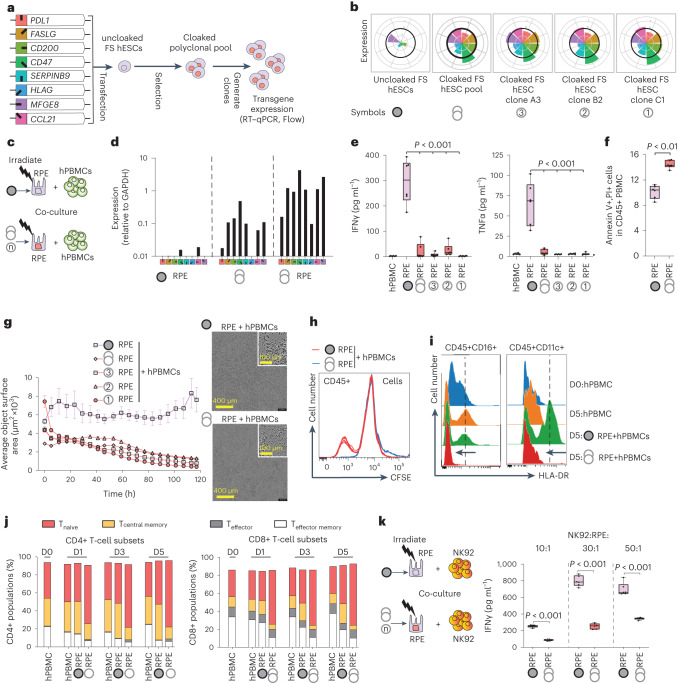
Fig. 4. Generation of cloaked hESCs and their properties.
a, Schema showing the generation of hESCs (containing the FS system), which overexpress eight human immunomodulatory transgenes (‘cloaked’) via insertion of transposon expression vectors. b, Expression level of each transgene was determined by RT–qPCR. Values shown are normalized to hPBMCs stimulated in vitro with αCD3ε and αCD28 antibodies (thick black line on each radial graph). The symbols at the bottom are used to designate the corresponding cell lines in further studies. c, Experimental design to characterize the interaction between cloaked RPE cells and hPBMCs. Uncloaked or cloaked hESCs were differentiated into RPEs, irradiated and then co-cultured with hPBMCs for use in downstream experiments (Fig. 4d–j). d, Expression of immunomodulatory transgenes relative to GAPDH by qPCR before and after RPE differentiation. The symbols correspond to the definitions in a and b. e, IFNg and TNFa levels in supernatants after 5 days co-culture of RPE cells and hPBMCs (boxes represent the 25th to 75th percentiles with median, whiskers represent the minimum–maximum; n = 6 independent wells with 3 independent experiments; two-tailed Student’s t-test). f, Levels of apoptosis in hPBMCs as measured by Annexin and PI after 24 hours co-culture with uncloaked or cloaked RPEs. g, Cell surface area in hPBMC + RPE co-cultures measured by phase-contrast microscopy (IncuCyte system) as a correlate of cell survival or death over 5 days. Images were taken every 6 hours (mean ± s.e.m., n = 6 independent wells for each group; average of 5 fields per well). Representative wells with individual phase-contrast field (upper right corner, outlined in white) are shown. h, Proliferation of hPBMCs in co-cultures as measured by CFSE. i, Two independent experiments showed MHC class II (HLA-DR) expression on monocytes (CD45+CD16+) and dendritic cells (CD45+CD11c+) of hPBMC after 5 days of co-culture with uncloaked versus cloaked RPEs. Dotted line indicates the mean peak intensity of HLA-DR expression at D5 of hPBMC co-culture with uncloaked RPE. j, Changes to the immune cell population and phenotyping using CyTOF after co-culture of uncloaked or cloaked RPEs with hPBMCs for 1, 3 and 5 days. Analysis of CD4+CD8+ T-cell (CD45+CD3+) subsets including Tnaive (CCR7+CD45RA+CD45RO−), Teffector (CCR7−CD45RA+CD45RO−), Tcentral memory (CCR7+CD45RA−CD45RO+) and Teffector memory (CCR7−CD45RA−CD45RO+) cells. k, The experimental design (left) and IFNg in supernatant (right) after 3 days co-culture at varying ratios of uncloaked or cloaked RPEs with the NK92 cell line (boxes indicate the 25th to 75th percentiles with median, whiskers represent the minimum–maximum; n = 6 independent wells with 3 independent experiments; two-tailed Student’s t-test).

