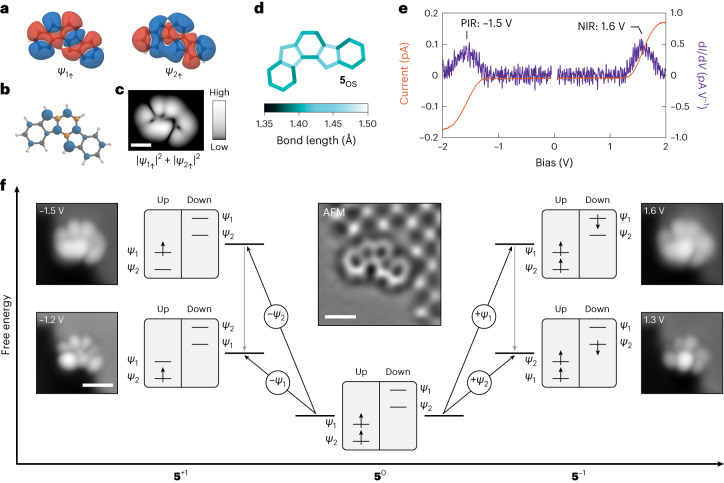
Fig. 2. Characterization of open-shell indeno[1,2-a]fluorene on bilayer NaCl/Au(111).
a, DFT-calculated wavefunctions of the frontier orbitals of 5OS in the triplet configuration for the spin up (occupied) levels (isovalue, 0.002 e− Å−3). Blue and red colours represent opposite phases of the wavefunction. Orbital densities (wavefunctions squared) are presented in Supplementary Fig. 12. b, Corresponding DFT-calculated spin density of 5OS (isovalue, 0.01 e− Å−3). Blue and orange colours represent spin up and spin down densities, respectively. c, Mean-field Hubbard local density of states map of the superposition of the SOMOs of 5OS, calculated at a height of 7 Å above the molecular plane. d, DFT-calculated bond lengths of 5OS. e, Constant-height I(V) spectra acquired on a species of 5 assigned as 5OS, along with the corresponding dI/dV(V) spectra. Open feedback parameters: V = −2 V, I = 0.17 pA (negative bias side) and V = 2 V, I = 0.17 pA (positive bias side). The acquisition position of the spectra is shown in Supplementary Fig. 7. f, Scheme of many-body transitions associated with the measured ionic resonances of 5OS, together with STM images of assigned 5OS at biases where the corresponding transitions become accessible. Scanning parameters: I = 0.3 pA (V = −1.2 V and −1.5 V) and 0.2 pA (V = 1.3 V and 1.6 V). Centre inset: Laplace-filtered AFM image of assigned 5OS. STM setpoint: V = 0.2 V, I = 0.5 pA on bilayer NaCl, Δz = −0.3 Å. The tip-height offset, Δz, is provided with respect to the STM setpoint, and positive (negative) values of Δz denote tip approach (retraction) from the STM setpoint. The STM and AFM images shown in f are of the same molecule at the same adsorption site, which is next to a third-layer NaCl island. The bright and dark features in the third-layer NaCl island in the AFM image correspond to Cl− and Na+ ions, respectively. The STS data shown in e were acquired on the molecule shown in f. Scale bars, 5 Å (simulated local density of states map and AFM image) and 10 Å (STM images).

