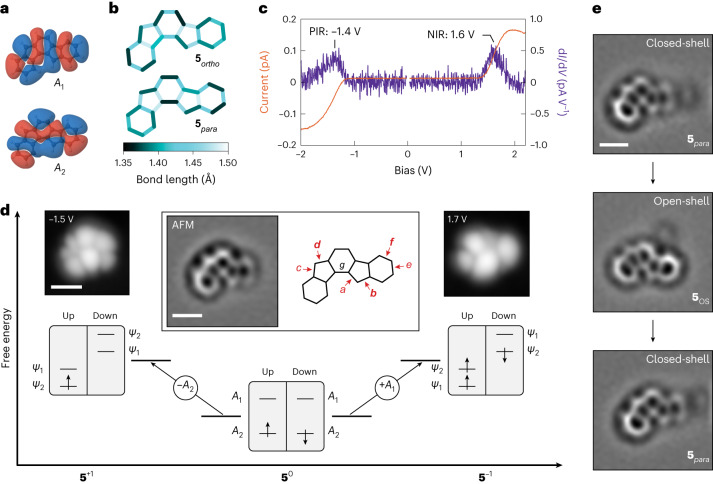
Fig. 3. Characterization of closed-shell indeno[1,2-a]fluorene on bilayer NaCl/Au(111).
a, DFT-calculated wavefunctions of the frontier orbitals of closed-shell 50 (isovalue, 0.002 e− Å−3). The wavefunctions shown here are calculated for the 5para geometry. Orbital densities (wavefunctions squared) are presented in Supplementary Fig. 12. b, DFT-calculated bond lengths of 5ortho (top) and 5para (bottom). c, Constant-height I(V) spectra acquired on a species of 5 assigned as 5para, along with the corresponding dI/dV(V) spectra. Open feedback parameters: V = −2 V, I = 0.15 pA (negative bias side) and V = 2.2 V, I = 0.15 pA (positive bias side). The acquisition position of the spectra is shown in Supplementary Fig. 7. d, Scheme of many-body transitions associated with the measured ionic resonances of 5para, together with STM images of assigned 5para at biases where the corresponding transitions become accessible. Scanning parameters: I = 0.15 pA (V = −1.5 V) and 0.2 pA (V = 1.7 V). Centre inset: Laplace-filtered AFM image of assigned 5para. STM setpoint: V = 0.2 V, I = 0.5 pA on bilayer NaCl, Δz = −0.7 Å. Here, the molecule is adsorbed on top of a defect on the surface. For an example of a 5para species adsorbed adjacent to a third-layer NaCl island, see Supplementary Fig. 15. Also shown in the inset are seven bonds labelled a–g to highlight the bond-order differences between 5para and 5ortho. For the bond pairs a/b, c/d and e/f, the bonds labelled in bold exhibit a higher bond order than their neighbouring labelled bonds in 5para. e, Laplace-filtered AFM images of 5 on bilayer NaCl/Cu(111) showing switching between 5OS and 5para as the molecule changes its adsorption position. Switching from 5para to 5OS was induced by scanning at 1.1 V, while switching from 5OS back to 5para took place by scanning at −2.2 V. The faint protrusion adjacent to 5 is a defect that stabilizes the adsorption of 5. STM setpoint: V = 0.2 V, I = 0.5 pA on bilayer NaCl, Δz = −0.3 Å. STS and STM data in c and d, respectively, are acquired on the same molecule, whereas the AFM image in d is acquired on a different molecule. Scale bars, 5 Å (AFM images) and 10 Å (STM images).

