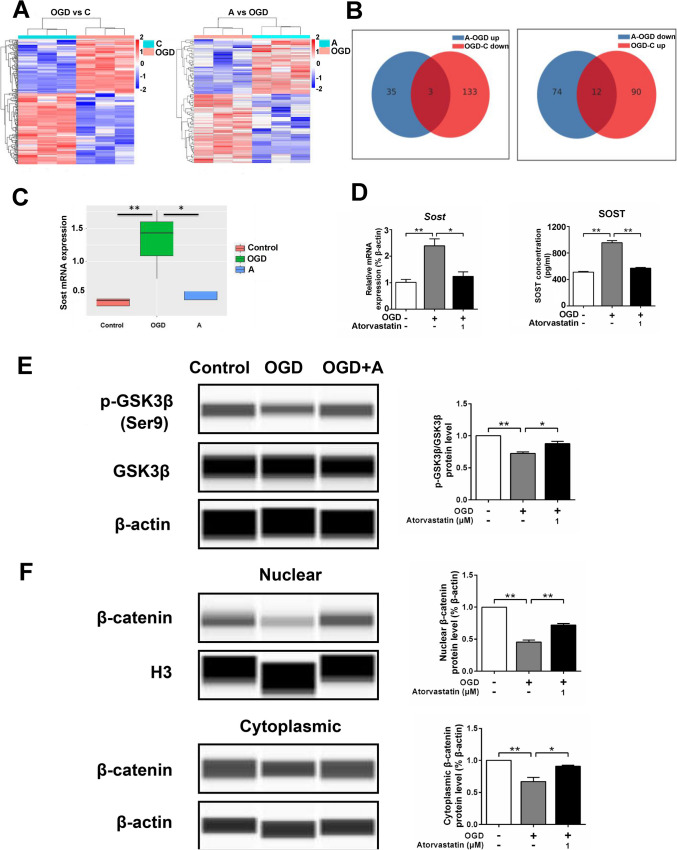
Fig. 2.
Sequencing analysis of microglia transcriptome. A Cluster map, relatively highly expressed protein-coding genes are shown in red and relatively low-expressed protein-coding genes are shown in blue. B The number of shared and unique differentially expressed genes between different comparison groups. C Transcriptome analysis of Sost mRNA expression. D The cell mRNA and cell culture supernatant protein level of SOST were detected by RT-qPCR and ELISA, respectively, n = 3/group. E, F The protein levels of p-GSK3β, GSK3β, and β-catenin were detected by the capillary western blot test, n = 3/group. Values represent the mean ± SEM. *p < 0.05, **p < 0.01 vs. the respective control

