Fig. 4.
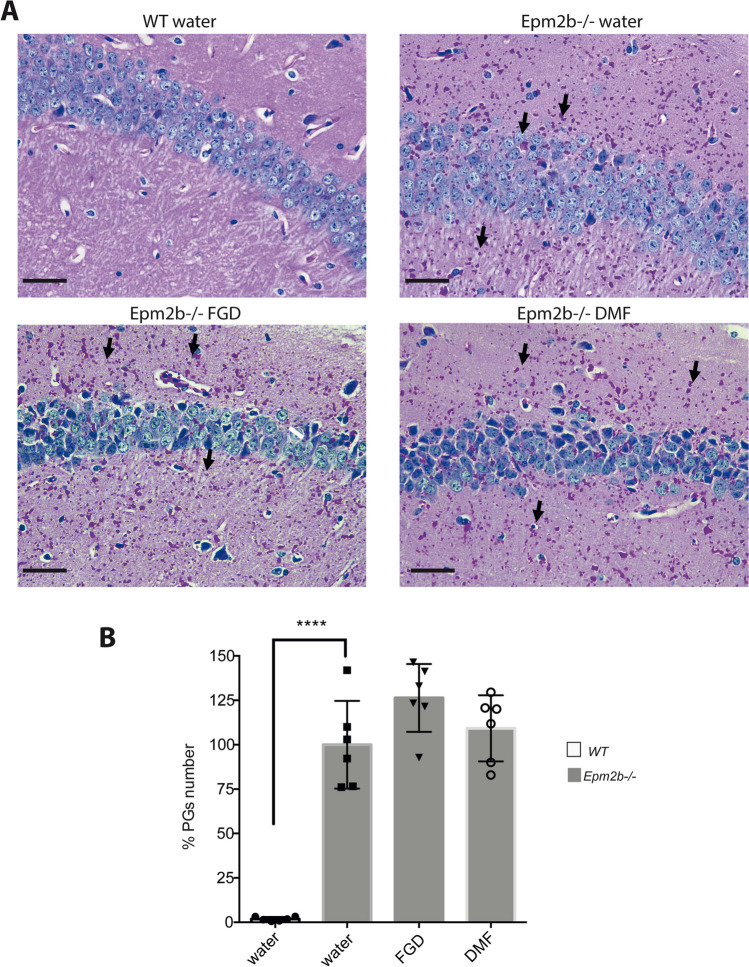
Accumulation of PGs in the hippocampus of Epm2b − / − mice and the therapeutic effect of fingolimod and dimethyl fumarate treatments. A Representative microscopy images of PGs detection (in pink; see also black arrows) in the CA1 region of the hippocampus by PAS staining; neural nuclei are in blue. The scale bar corresponds to 50 µm. B Percentage (%) of PG numbers versus the number present in untreated Epm2b − / − mice. Bar graphs show the mean ± standard deviation of the mean (SD). Statistical differences were analyzed by one-way ANOVA following Tukey’s multiple comparison tests. Statistical significance was defined as ****P < 0.0001 (n, 6 in all the groups) (see Supplementary Table S1)

