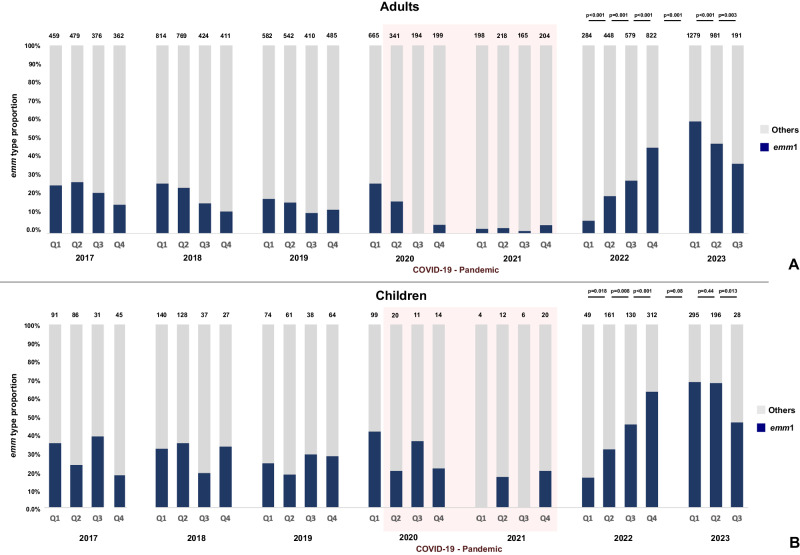
Fig. 2. Contribution of emm1 S. pyogenes to invasive group A streptococcal (iGAS) infections 2017–2023.
emm1 isolates are shown as proportions of the total number of isolates from iGAS cases submitted to and genotyped at the national reference laboratory for each quarter of each year. A adults ( ≥ 15 years); B children <15 years. The total number of isolates from iGAS cases received by the reference laboratory and genotyped in each quarter are shown on top of each bar; emm1 proportions are shown in navy blue. Pink shaded region highlights the period of COVID-19 non pharmaceutical interventions. Q1, January-March; Q2, April-June; Q3, July- September; Q4, October-December. Statistical analysis applied to 2022-2023: one-tailed proportion test of emm1 from Q1 2022 to Q3 2023 (p-values indicated in the figure). Source data are provided as a Source Data file Fig. 2.

