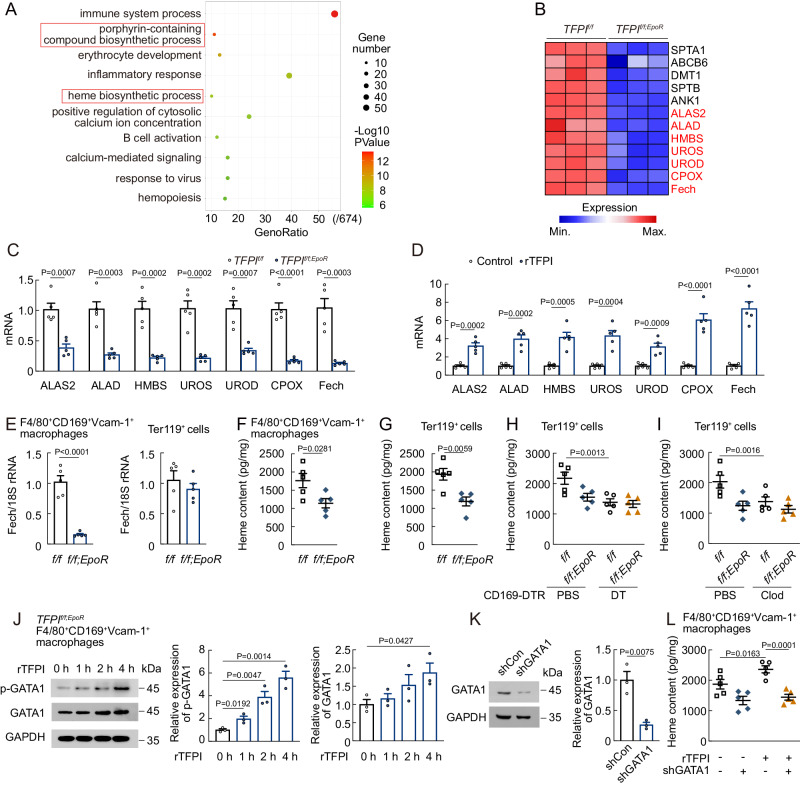
Fig. 3. TFPI affects signaling pathways in F4/80+CD169+Vcam-1+ macrophages.
A GO term enrichment analysis of differentially expressed genes in F4/80+CD169+Vcam-1+ macrophages between TFPIf/f and TFPIf/f;EpoR mice. B Heatmap of differential gene expression. C mRNA expression of ALAS2, ALAD, HMBS, UROS, UROD, CPOX, and Fech in F4/80+CD169+Vcam-1+ macrophages of TFPIf/f;EpoR mice (n = 5). D mRNA expression of ALAS2, ALAD, HMBS, UROS, UROD, CPOX, and Fech in F4/80+CD169+Vcam-1+ macrophages of rTFPI-treated mice (n = 5). E Fech mRNA expression in F4/80+CD169+Vcam-1+ macrophages and Ter119+ cells of TFPIf/f;EpoR mice (n = 5). (F and G) Heme content in F4/80+CD169+Vcam-1+ macrophages F and Ter119+ cells G of TFPIf/f;EpoR mice (n = 5). H Heme content in Ter119+ cells of TFPIf/f;EpoR;CD169DTR/+ mice after DT treatment (n = 5). I Heme content in Ter119+ cells of TFPIf/f;EpoR mice after clodronate liposomes treatment (n = 5). J p-GATA1 and GATA1 protein levels in F4/80+CD169+Vcam-1+ macrophages of TFPIf/f;EpoR mice (n = 3). K GATA1 protein expression of F4/80+CD169+Vcam-1+ macrophages after GATA1 shRNA treatment (n = 3). L Heme content in F4/80+CD169+Vcam-1+ macrophages of TFPIf/f mice after treated with rTFPI and GATA1 shRNA (n = 5). Statistical analysis was performed using one-way ANOVA (A, and C–L). Data are shown as mean ± SEM and are representative of two (E–I) or three (C, D, and J-L) independent experiments. Source data are provided as a Source Data file.

