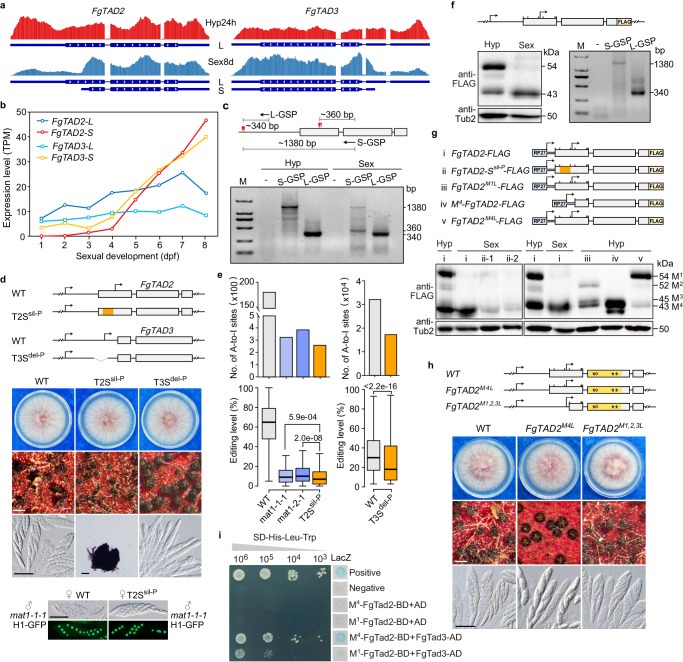
Fig. 2. Transcriptional and translational regulation of FgTad2-FgTad3.
a RNA-seq read coverage showing expressions of long (L) and short (S) transcripts of FgTAD2 and FgTAD3 in hyphae (Hyp24h) and perithecia (Sex8d). b RNA-seq expression levels of the L-/S-transcripts of FgTAD2 and FgTAD3. c 5’RACE determining the transcriptional initiation sites (marked by red triangles) of the FgTAD2 L-/S-transcripts. Expected sizes for each band are indicated. M, DNA markers; GSP, gene-specific primers. d Morphology of colonies, perithecia, and asci/ascospores of PH-1 (WT), T2Ssil-P, and T3Sdel-P mutants. Four of 8 ascospores display GFP signals in an ascus from outcrosses of marked strains. White bar = 0.2 mm; black bar = 20 μm. In schematic diagrams, arrows indicate transcriptional initiation sites, and boxes indicate CDS regions. Broken lines represent deletion regions, while the region introduced multiple synonymous mutations is highlighted in orange. e Number of A-to-I editing sites and editing levels of shared sites (n = 392 and 19,069 for left and right panels, respectively) in 7-dpf perithecia of marked strains. data are presented in bar graphs as mean of two independent replicates. Boxplots indicate median (middle line), 25th, 75th percentile (box), and 1.58x interquartile range (whisker). P-values are from two-tailed Wilcoxon rank sum tests. f Western blots of total proteins isolated from 24 h hyphae (Hyp) and 7-dpf perithecia (Sex) of the transformant in situ expressing FgTad2-3×FLAG, probed with anti-FLAG antibodies. Only the FgTAD2 L-transcript was detected by 5’RACE in the hyphae of this transformant. g Western blots of total proteins isolated from 24 h hyphae (Hyp) and 7-dpf perithecia (Sex) of transformants ectopically expressing indicated constructs. The first seven in-frame AUG (M) codons are marked with a bar on the CDS box in schematic diagrams. h Morphology of colonies, perithecia, and asci/ascospores of marked strains. White bar = 0.2 mm; black bar = 20 μm. The CDA domain region is highlighted in orange in schematic diagrams. i Y2H assays for the interaction of the FgTad2 M1- or M4-protein (BD-bait) with FgTad3 (AD-prey). Photos show growth on SD-His-Leu-Trp plates at indicated concentrations, along with the LacZ β-galactosidase activity. Source data are provided as a Source Data file.

