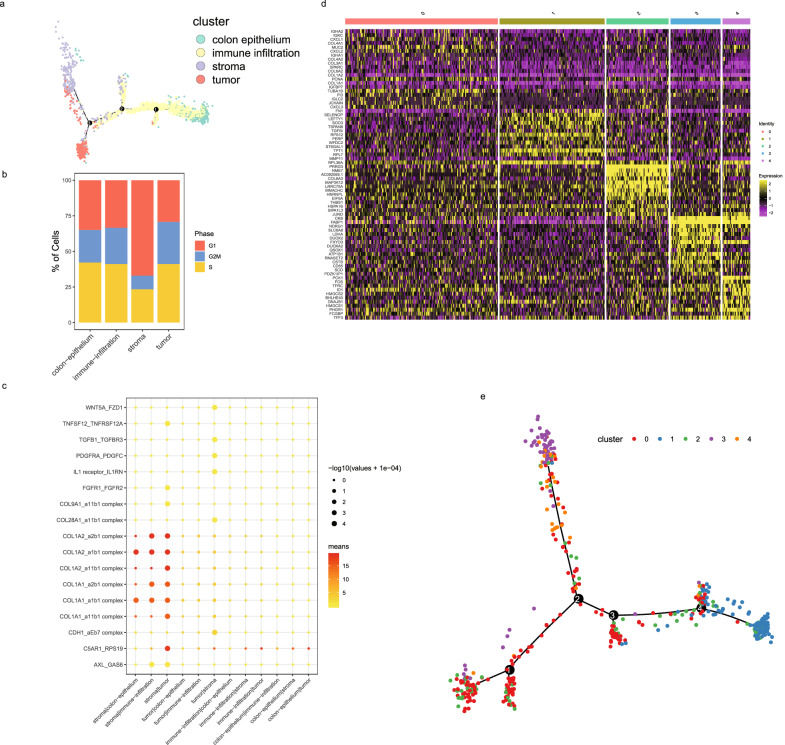
Fig. 4. The trajectory and interactions of cell lineages at spatial resolution.
a The trajectory of all ST spots of CRC5_1 cryosection in the ST-seq dataset, color-coded by four annotated, spatial regions (tumor, stroma, immune infiltration, colon epithelium, as shown in Fig. 3c. b The distribution of ST spots of CRC5_1 cryosection on cell cycle phases. c Receptor-ligand pair expression in each pair of spatial regions in CRC5_1 cryosection using CellPhoneDB. d Hierarchical clustering of ST spots from the tumor region in CRC5_1 cryosection and indicative of five tumor subtypes based on five transcriptomic signatures. e The trajectory of five tumor subregions.

