Fig. 2.
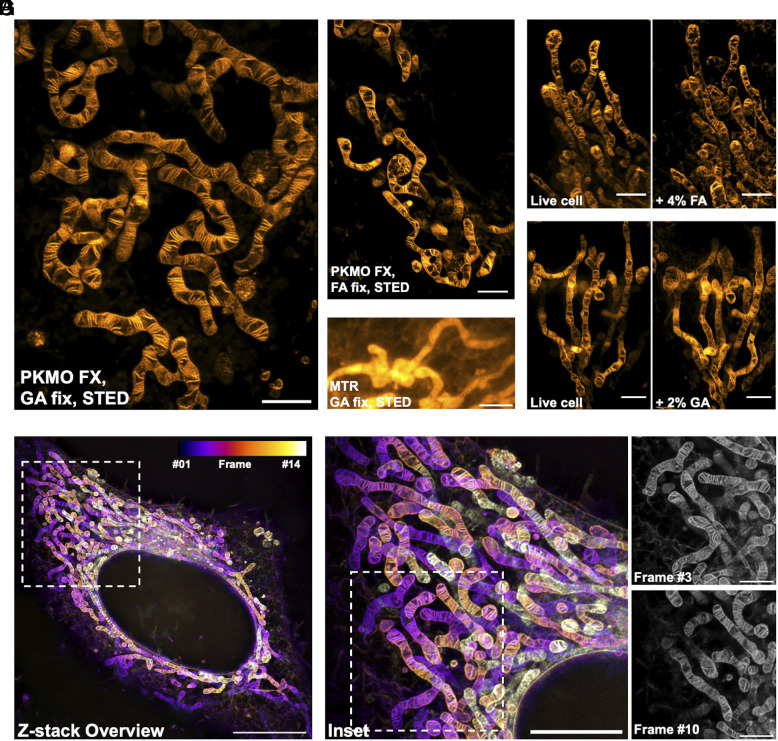
PKMO FX enables nanoscopic STED imaging of mitochondria in fixed cells. (A) STED imaging of mitochondrial cristae of a fixed COS-7 cell labeled with PKMO FX and fixed with 2.5% GA. (Scale bar, 2 μm.) (B) STED imaging of mitochondrial cristae of a fixed COS-7 cell labeled with PKMO FX and fixed with 4% FA. (Scale bar, 2 μm.) (C) STED imaging of mitochondria from a fixed HeLa cell labeled with MTR and fixed with 2.5% GA. (Scale bar, 2 μm.) (D and E) STED imaging of mitochondria labeled with PKMO FX in the same area before and after FA/GA fixation. After live cell imaging, 4% FA (D) or 2% GA (E) fixative was added to cells and STED images were acquired after 3 min. (Scale bar, 2 μm.) (F) Z-stack STED images of a HeLa cell labeled with PKMO FX and fixed with 2% GA. Color code image shows the whole-cell 3D reconstruction from 14 individual z-section images. Step size = 156 nm. (Scale bar, 10 µm.) (G, Left) Magnified images of the white boxed areas in F. (Scale bar, 5 µm.) Right: two close-up z-section images from frame #3 and #10. (Scale bar, 2 µm.)

