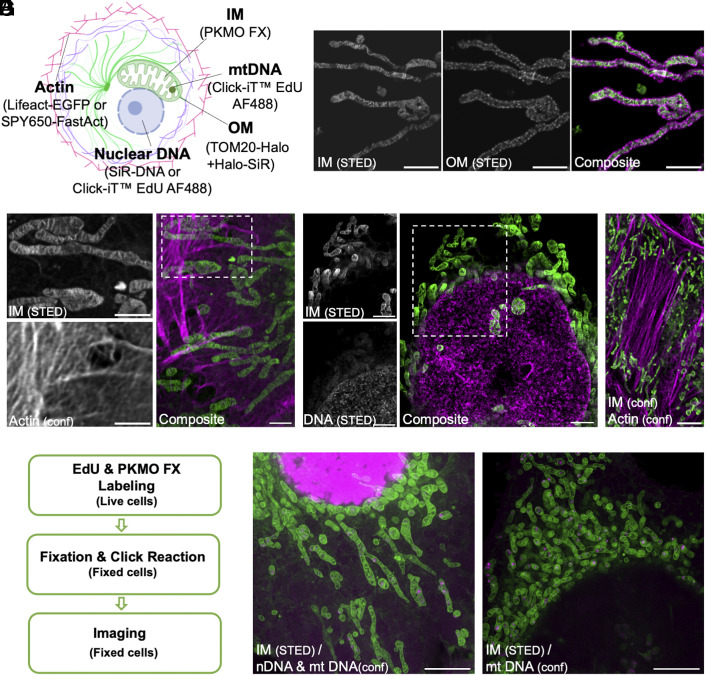
Fig. 4.
PKMO FX is compatible with various labeling strategies to achieve multicolor imaging of fixed cells. (A) Multicolor labeling strategies for imaging of mitochondrial subcompartments and related organelles. Abbreviations: IM (inner mitochondrial membrane); OM (outer mitochondrial membrane). (B) Two-color STED images of HeLa cells transfected with HaloTag-TOM20 and labeled with CA-SiR for OM and PKMO FX for IM. From Left to Right: split channels of IM, OM, and composite. (Scale bars, 2 μm.) (C) Two-color STED and confocal images of HeLa cells transfected with Lifeact-EGFP and stained with PKMO FX. Left: zoomed-in images of the white boxed areas of IM and actin. Actin was recorded in the confocal mode. Right: composite. (Scale bars, 2 μm.) (D) Two-color STED images of HeLa cells costained with PKMO FX and a fixable DNA probe: SiR-DNA. Left: zoomed-in images of the white boxed areas of IM and DNA. Right: composite. (Scale bars, 2 μm.) (E) Two-color confocal images of HeLa cells costained with PKMO FX and a fixable actin probe: SPY650-FastAct. (Scale bar, 5 μm.) (F) Flowchart showing the experimental procedure of the EdU-based metabolic labeling. (G) Two different cell states demonstrated by metabolic labeling. Left: cell cycle state I in which both nascent nuclear DNA (nDNA) and nascent mitochondrial DNA (mtDNA) are present. Right: cell cycle state II in which only nascent mtDNA spots are present. (Scale bars, 5 μm.)

