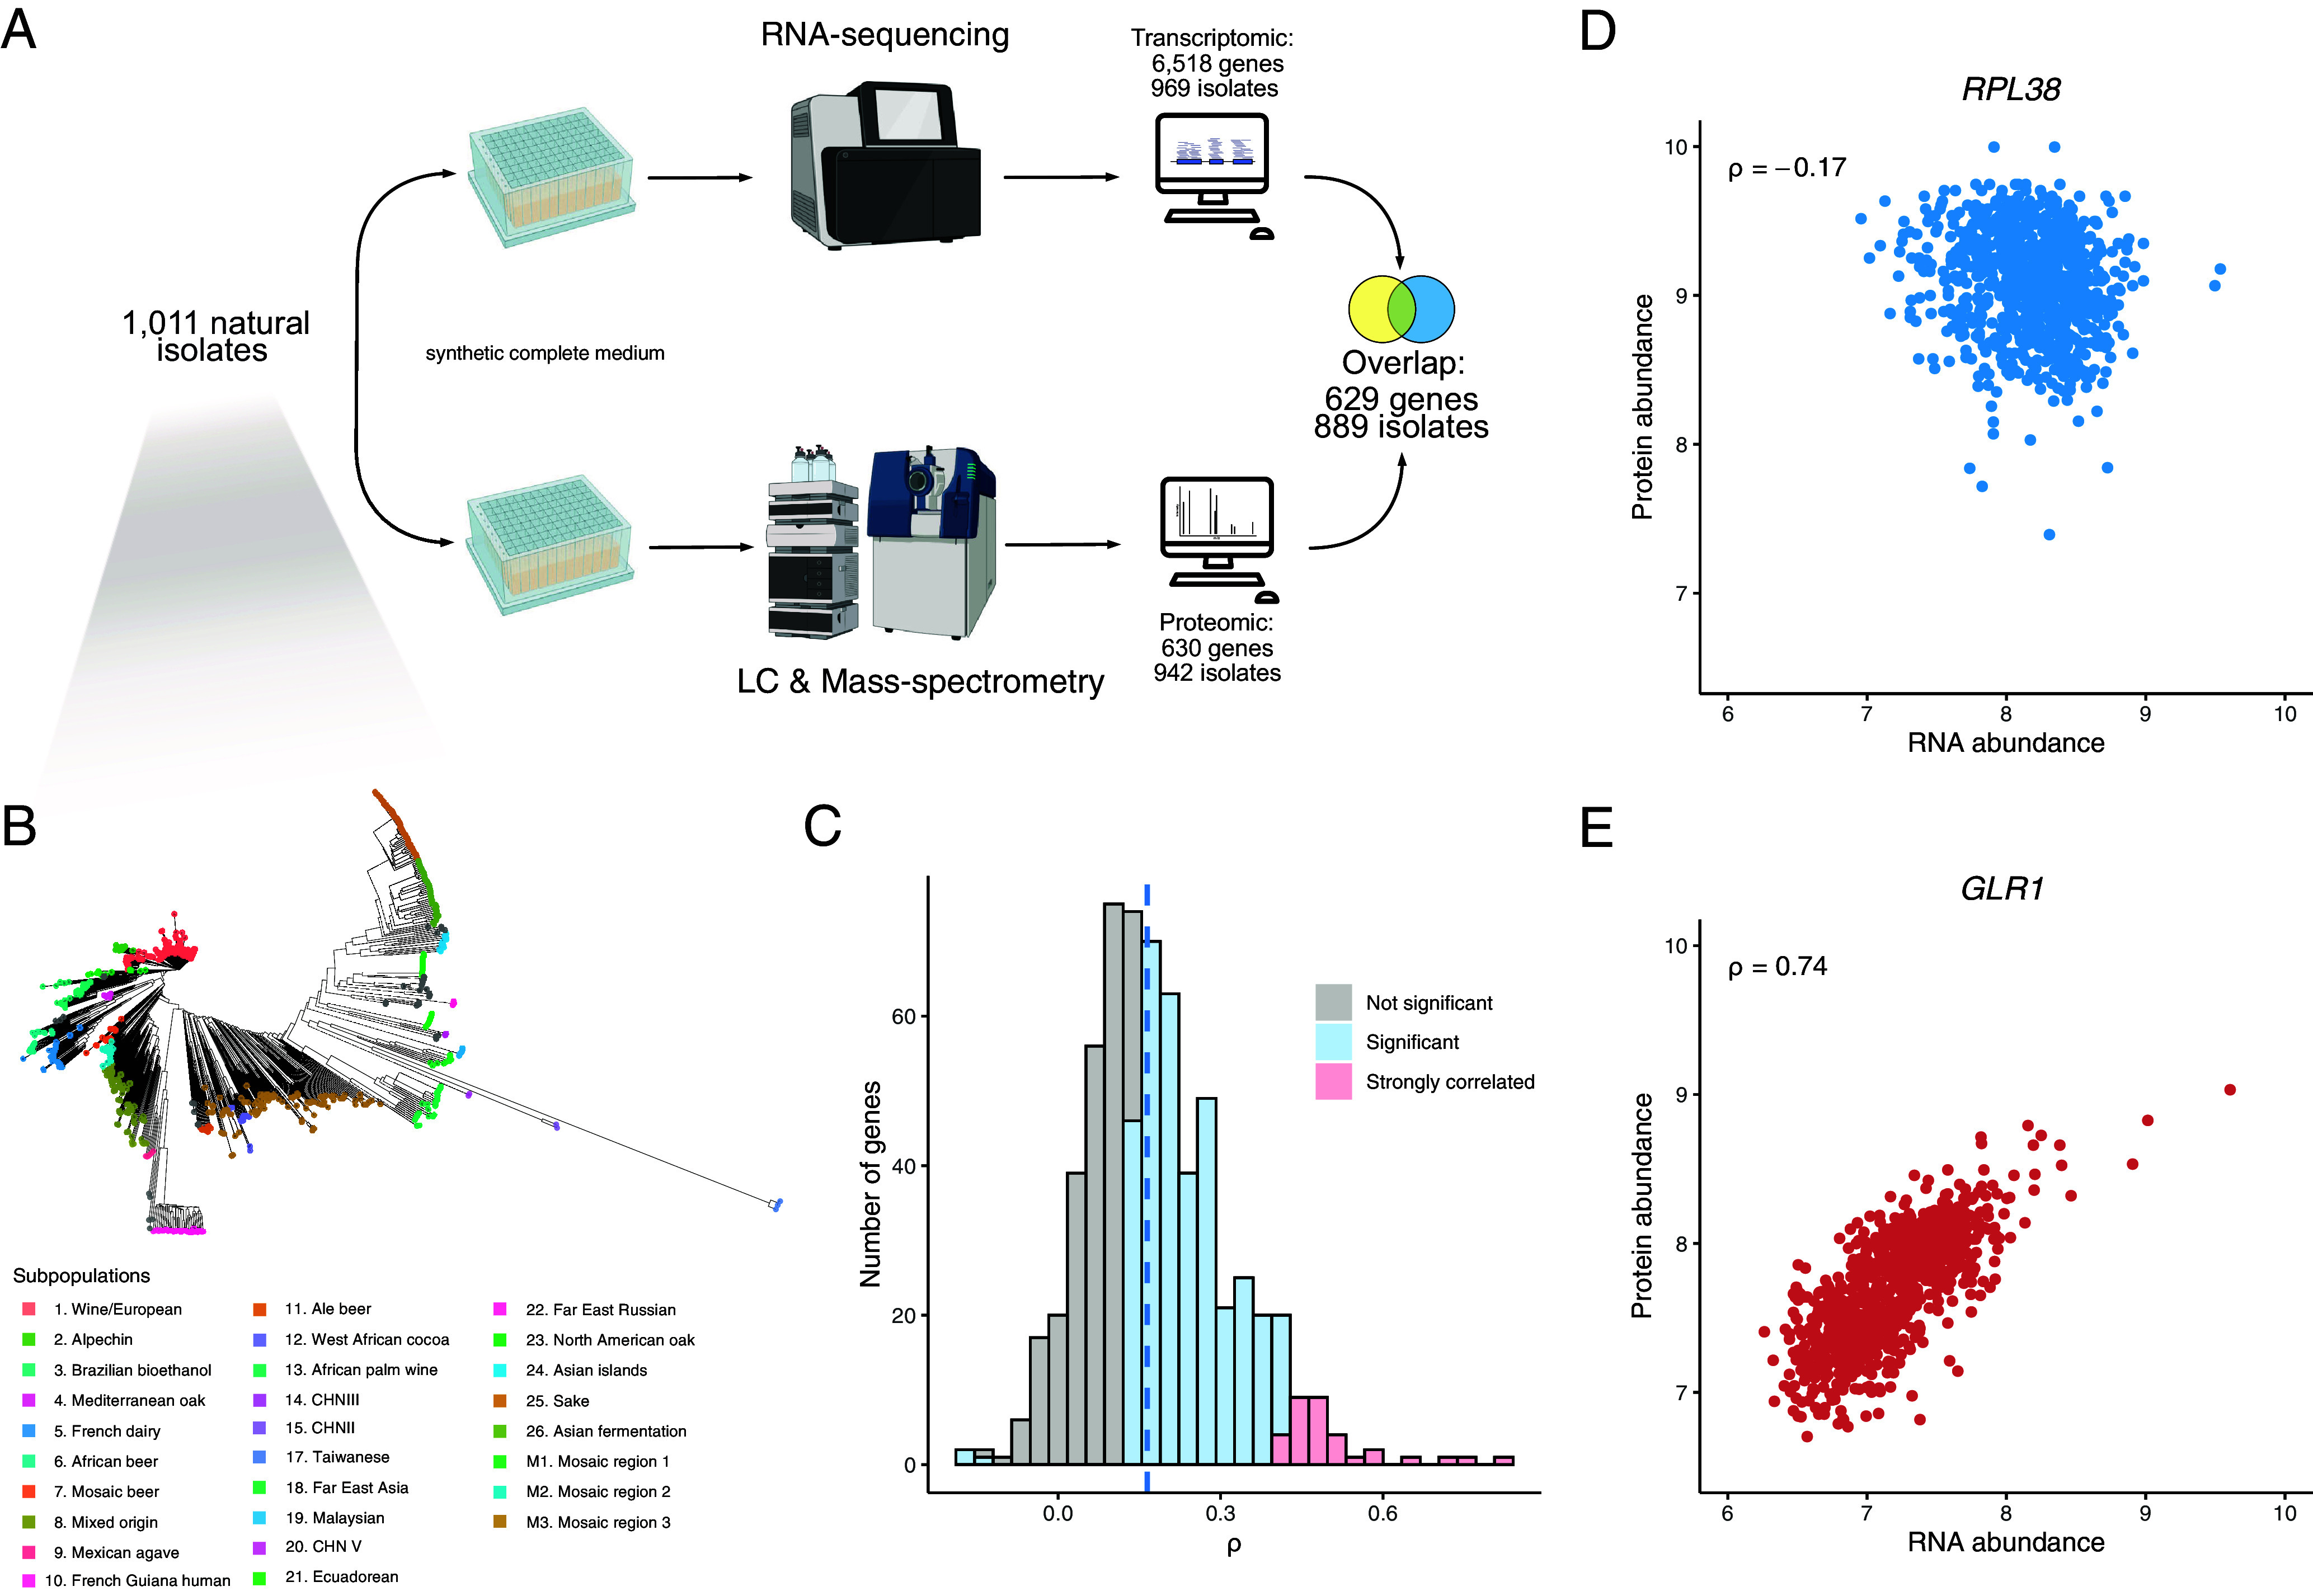
Fig. 1.

Quantitative proteomes and transcriptomes of a large S. cerevisiae population. (A) The proteomic dataset was generated on isolates grown in synthetic complete (SC) medium with amino acids using a semiautomated sample preparation workflow, and Scanning-SWATH MS (Methods). The overlap between this dataset and the recently generated transcriptomic dataset on the same population in the same condition (44) resulted in 629 protein/transcript abundances across 889 isolates. (B) Phylogenetic trees of the isolates used in this study. Colors correspond to previously defined subpopulations (43). (C) Gene-wise correlation coefficients (Spearman correlation test) between the proteome and the transcriptome. (D and E) mRNA–protein within-gene correlation across isolates for the RPL38 and GLR1 genes (ρ corresponds to the Spearman correlation coefficient with P-values of 4.8 × 10⁻⁷ and 2.3 × 10−153, respectively).
