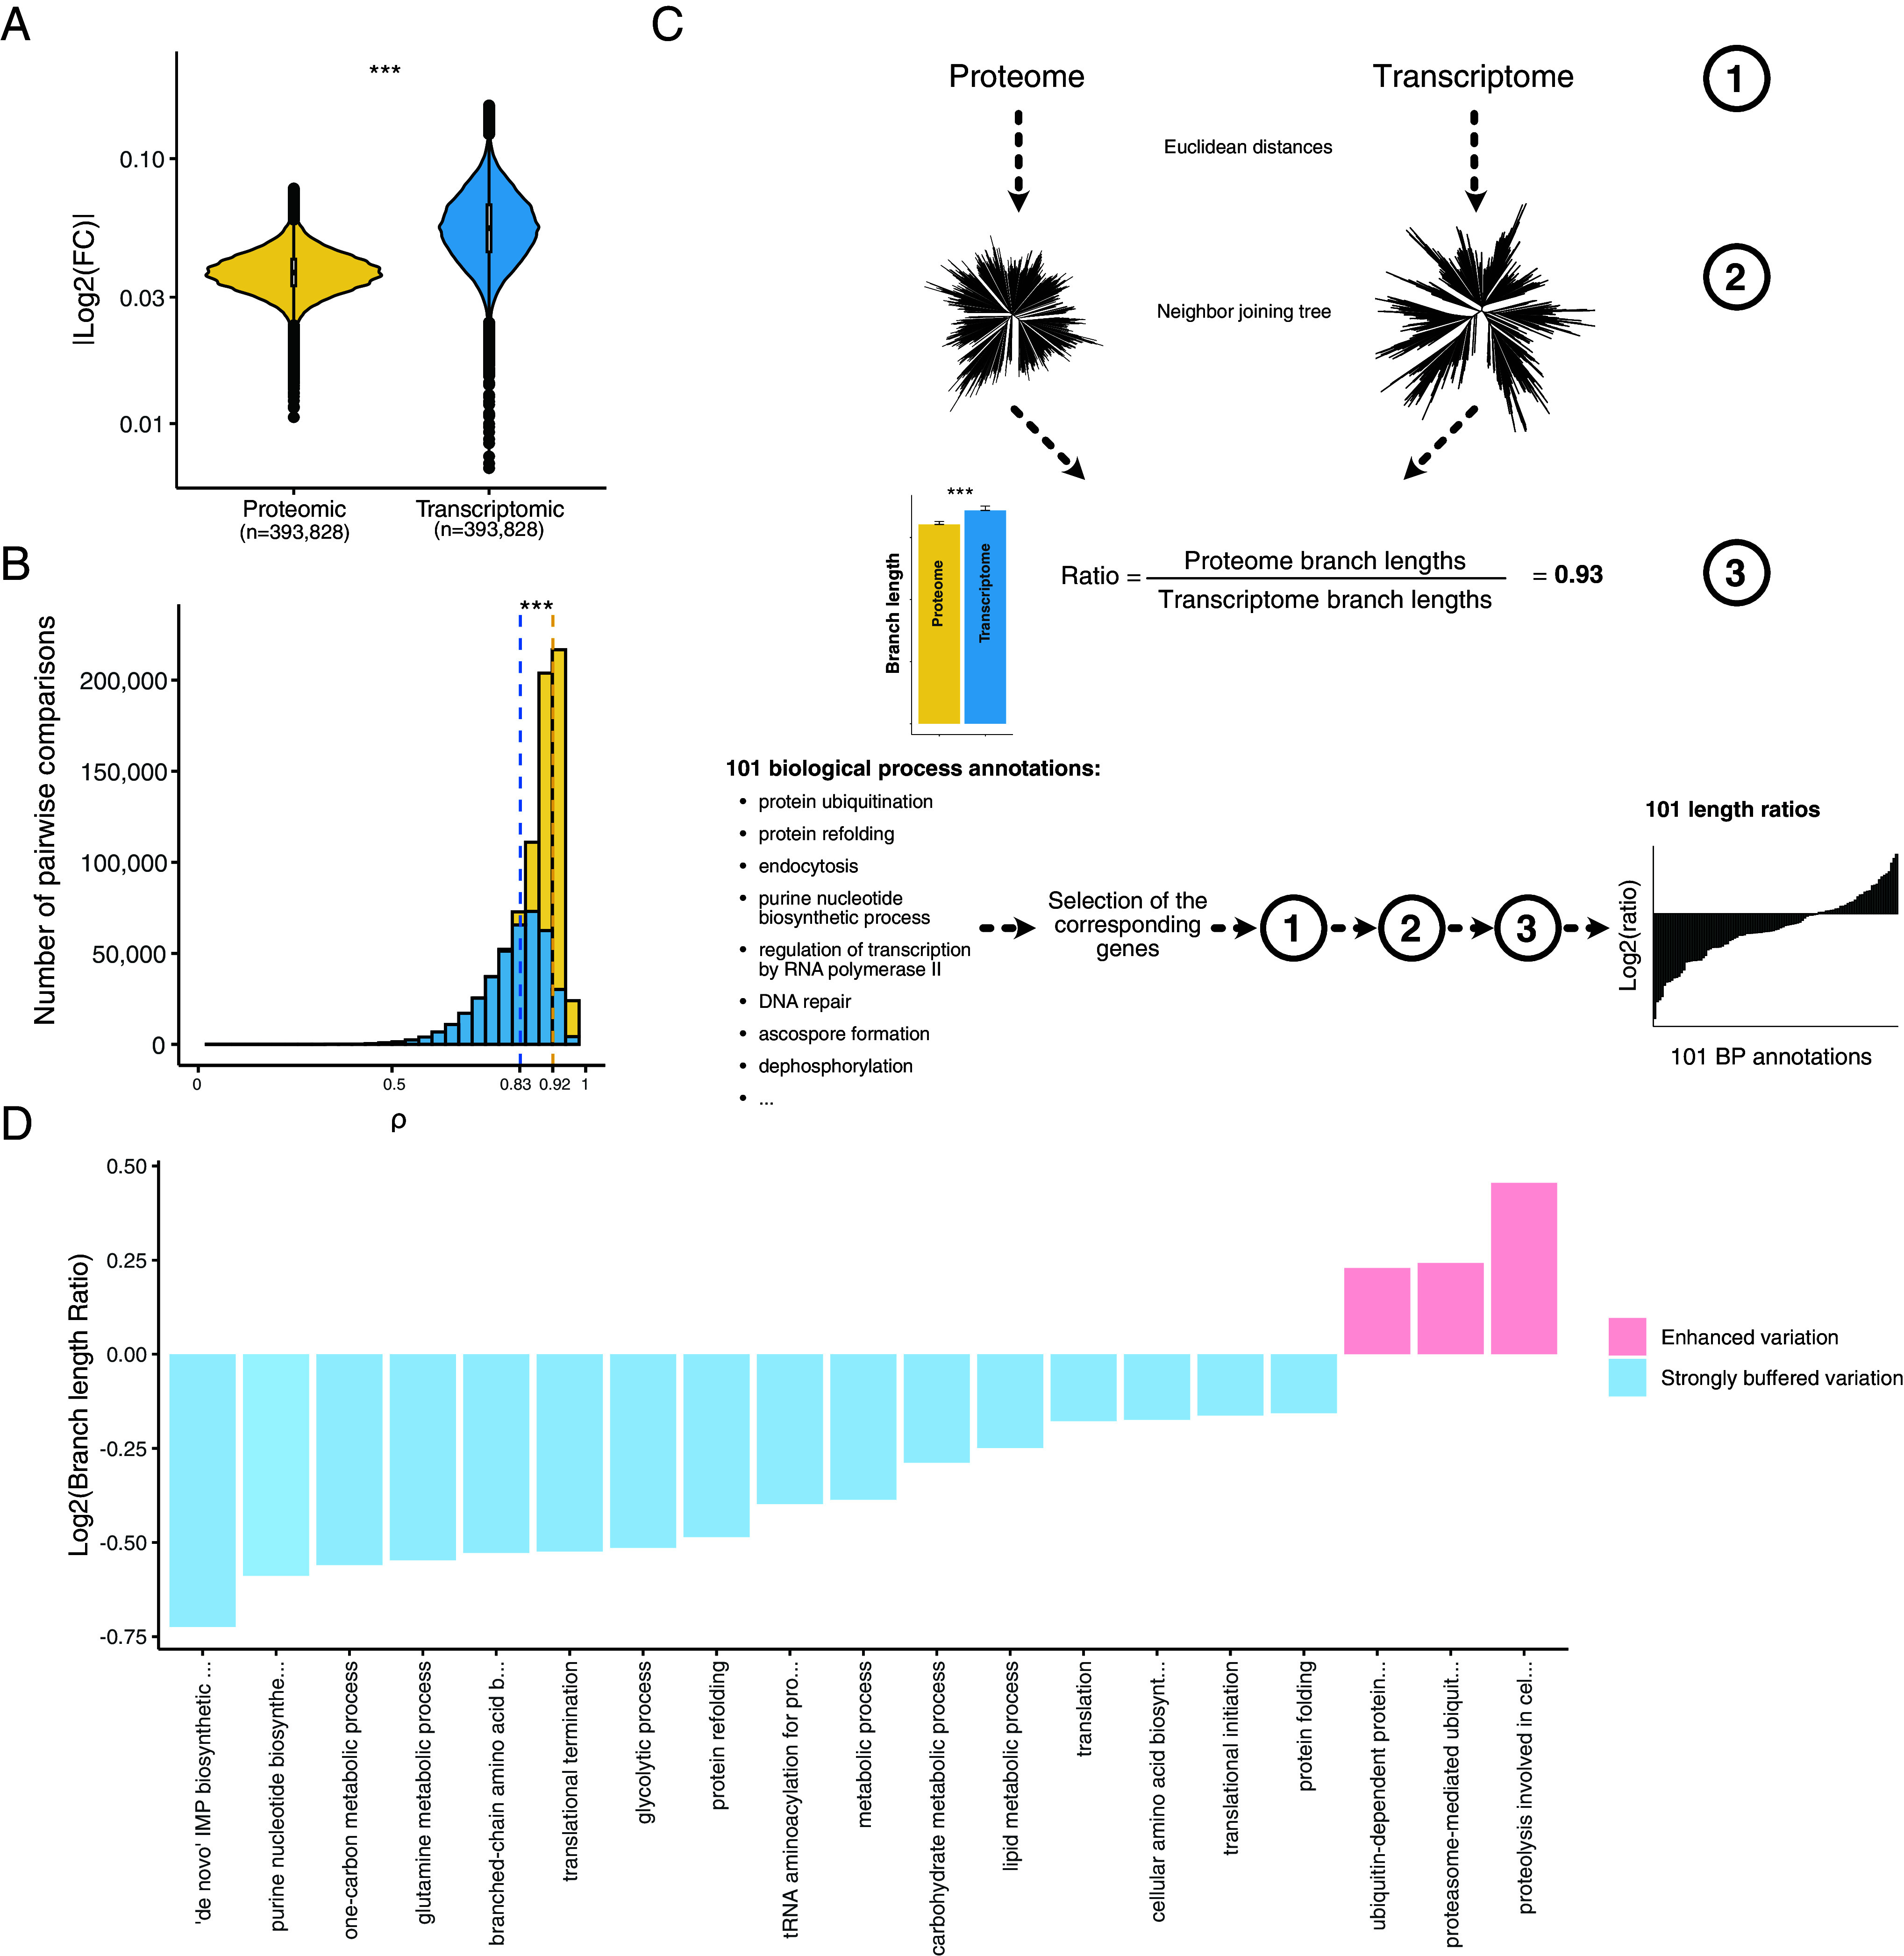
Fig. 2.

Detection and functional description of the post-transcriptional buffering. (A) Median |log2(fold changes)| computed in each isolate pairwise comparison using both proteomic and transcriptomic data (*** = Wilcoxon test, P-value < 2.2 × 10⁻¹⁶) (Methods). (B) Correlation coefficients from the isolate pairwise comparisons using both protein and transcript abundance (*** = Wilcoxon test, P-value < 2.2 × 10⁻¹⁶). The dotted lines correspond to the median correlation index for the proteomic (yellow) and transcriptomic (blue) data. (C) Cellular functions that are preferentially affected by post-transcriptional buffering. Briefly, using either the proteome and the transcriptome abundances (1) we constructed expression-based neighbor-joining trees (2) and compared the total sum of the branch lengths. We computed a ratio (3) defined by the proteome total branch lengths divided by the transcriptome total branch lengths. Using all the genes, this ratio was equal to 0.93 (overall, the expression evolution is more constrained at the proteome level). We performed the same procedure using subsets of genes corresponding to 101 biological process annotations. The biological processes displaying a ratio lower than 0.93 and a significant difference in terms of branch lengths (Methods) were considered as strongly buffered. The biological processes displaying a ratio higher than 1 and a significant difference in terms of branch lengths had an enhanced abundance variation at the proteome level. (D) Biological processes detected as strongly buffered or with an enhanced variation using the procedure detailed in (C).
