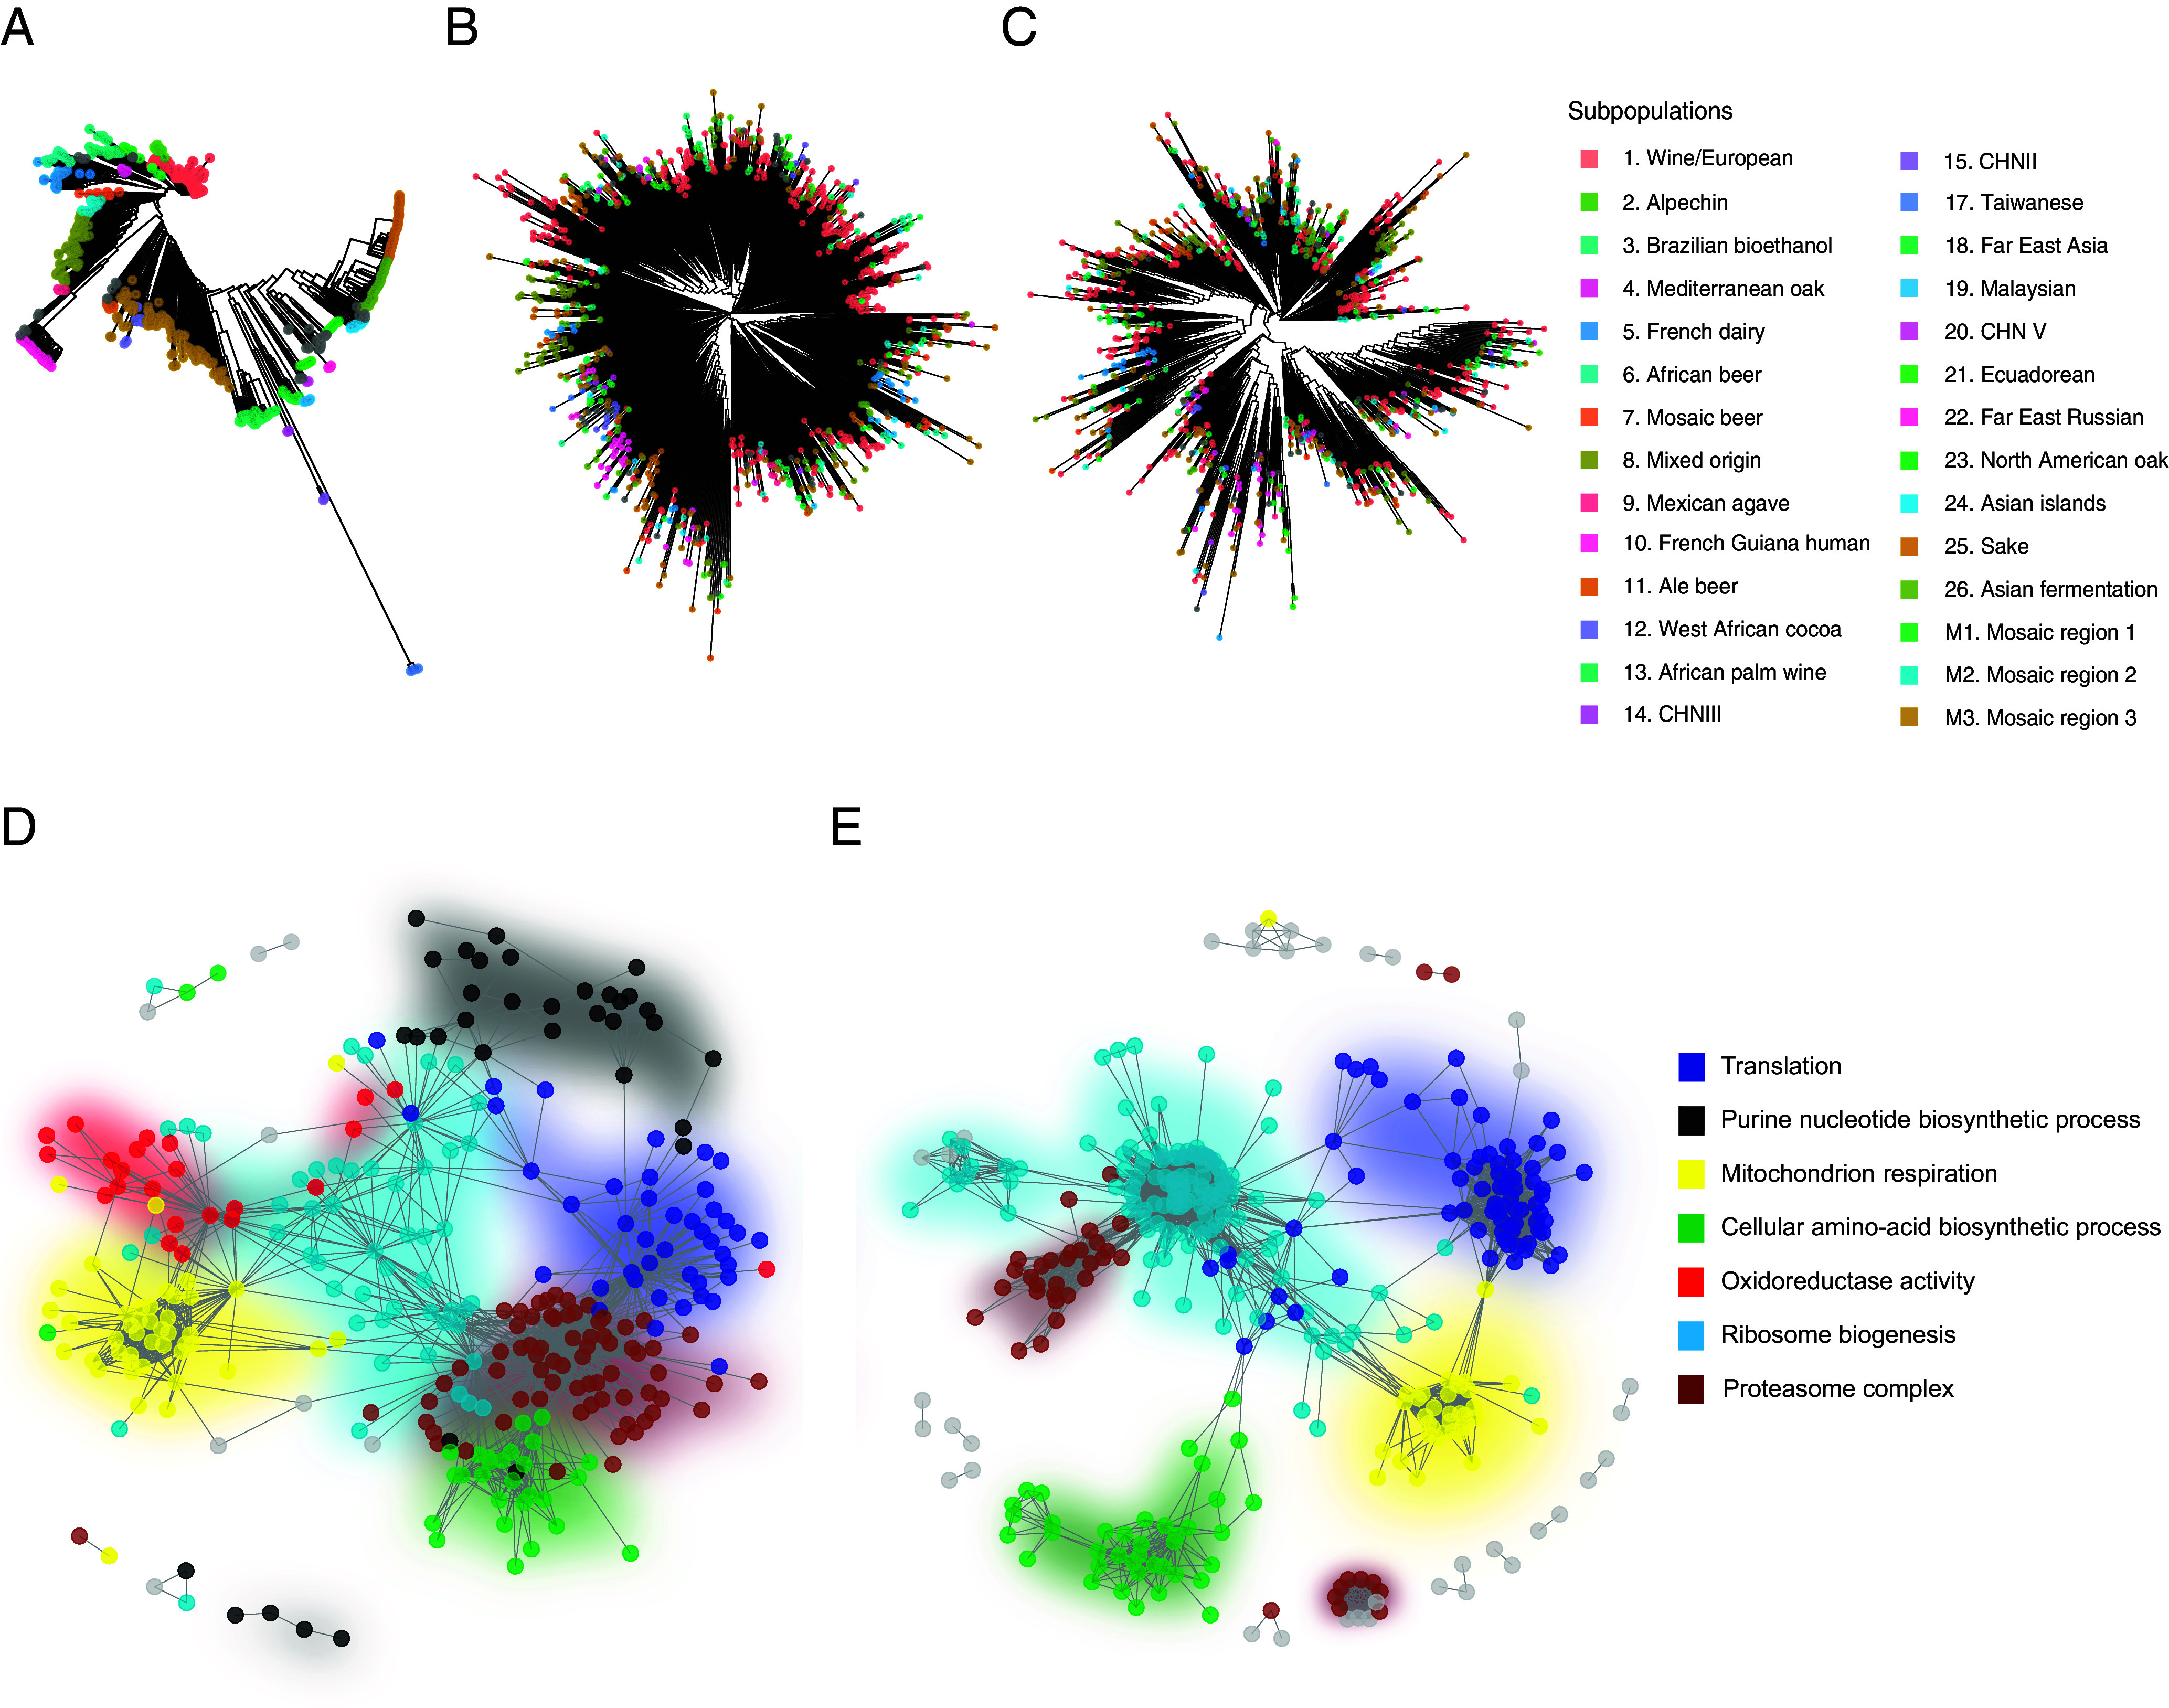
Fig. 3.

Coexpression network is a major determinant of the proteome organization while the population structure is not. (A–C) Comparison between the phylogenetic tree (A) obtained using the biallelic SNP (as in ref. 43) and the trees obtained from the Euclidean distances based on protein (B) or transcript (C) abundance. Colors correspond to the subpopulations. (D and E) Cellular coexpression network computed with WGCNA using proteomic (D) or transcriptomic (E) data. Colors represent the cellular pathway detected for each coexpression module.
