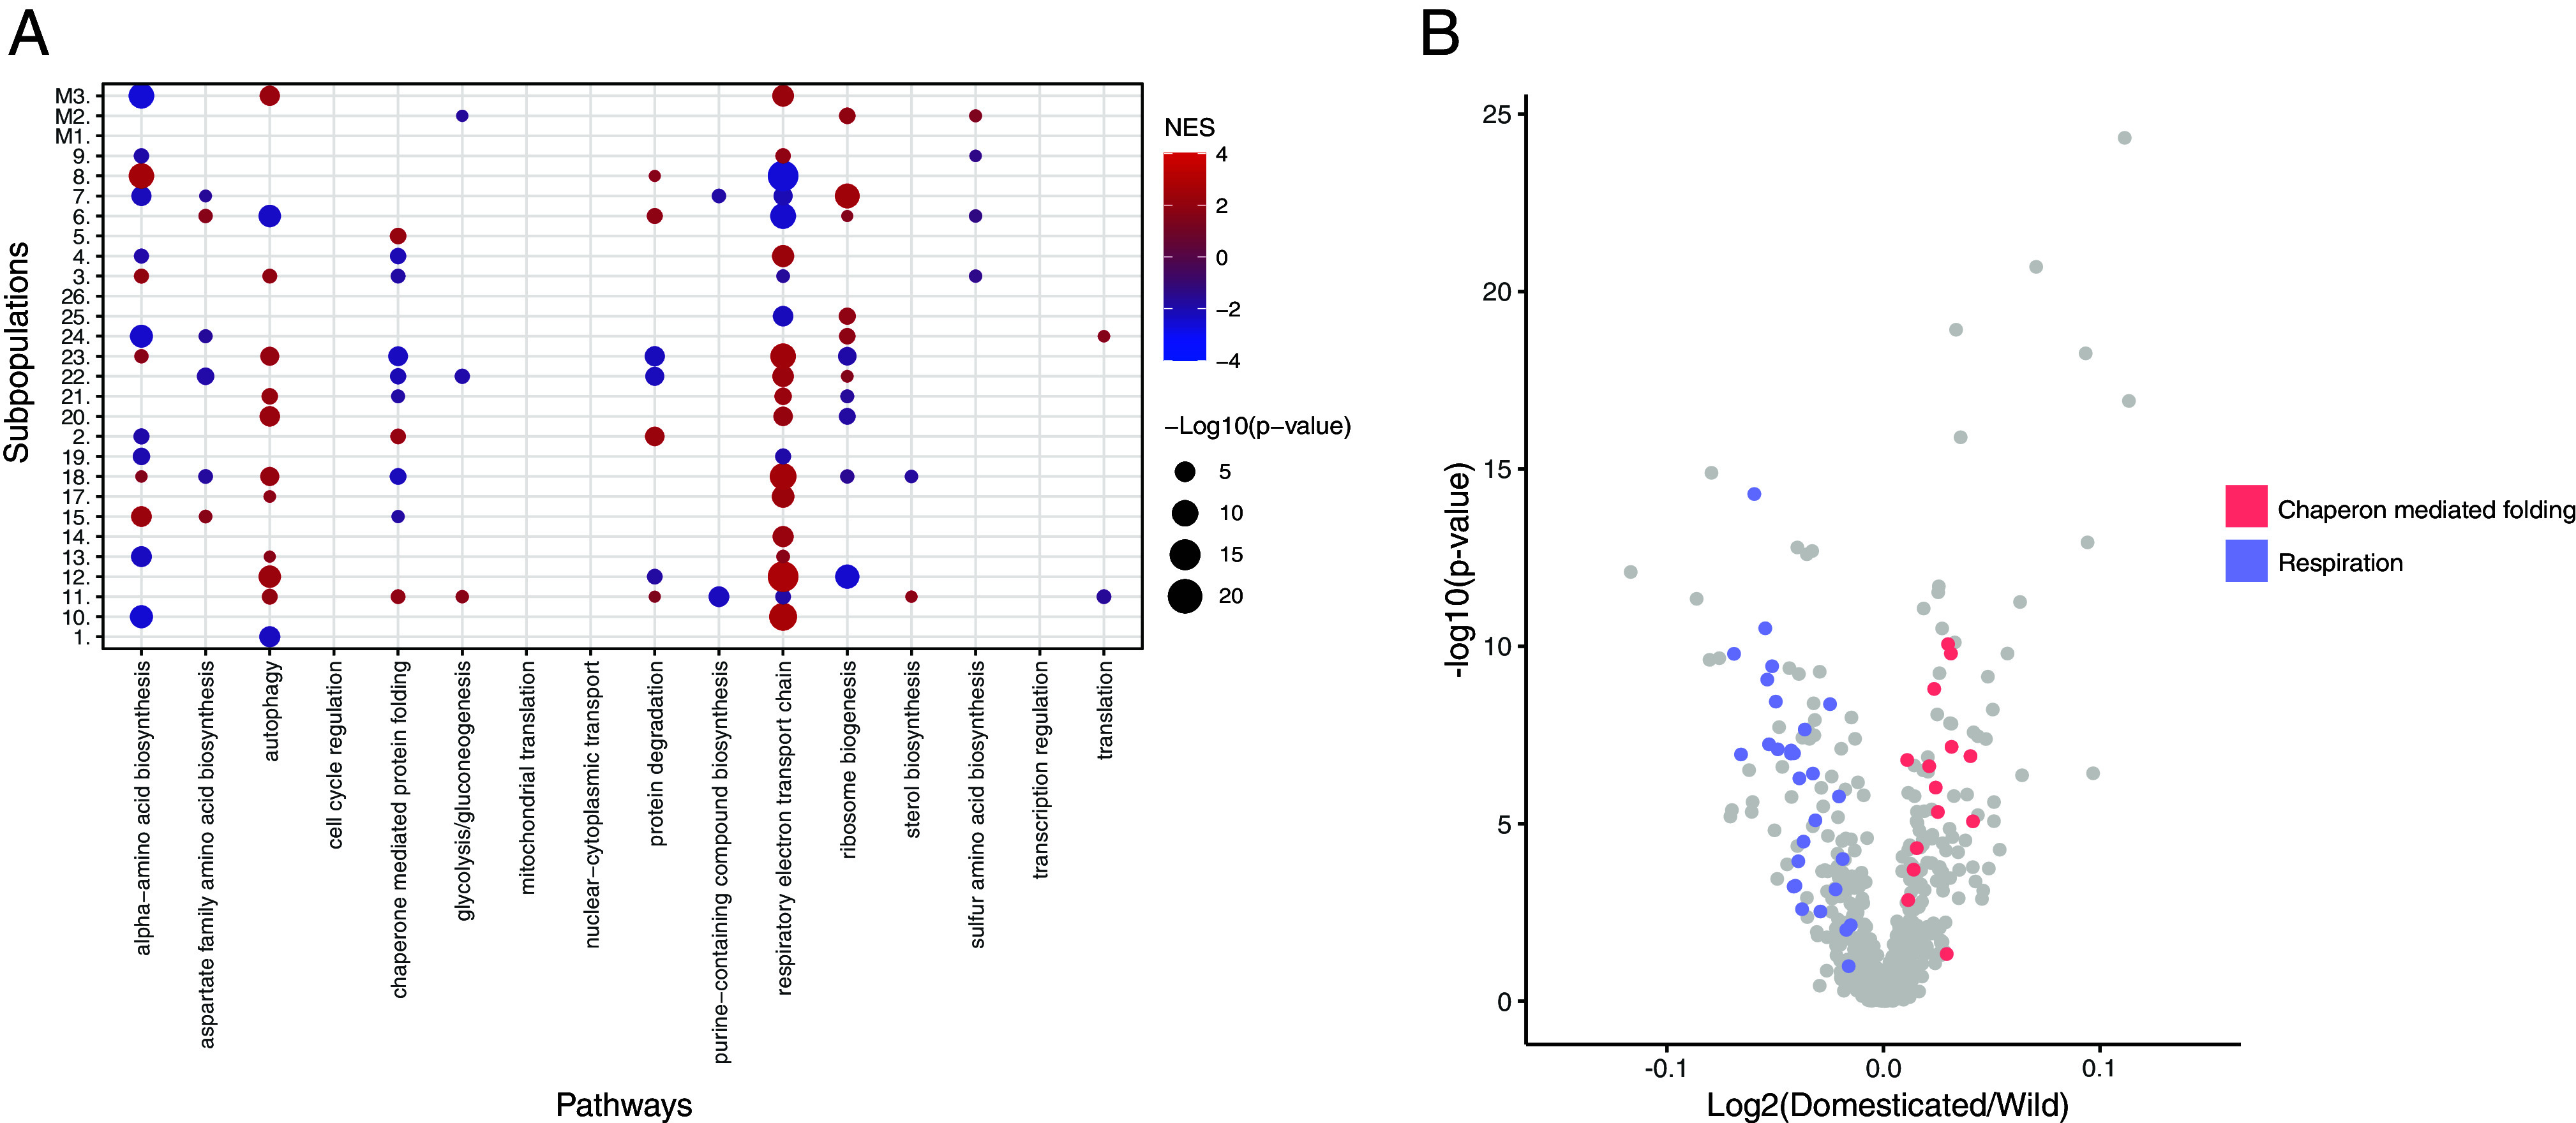
Fig. 4.

DEPs reveal domestication- and subpopulation-specific metabolic adaptation. (A) GSEA results on the DEPs (using 16 broad functional annotations from ref. 44) of each subpopulation. Colors represent the normalized enrichment score (NES): Red—overexpression, blue—underexpression in subpopulation. (B) Volcano plot of the comparison between wild and domesticated isolates. Colors highlight the genes belonging to two functional annotations related to chaperon-mediated folding and respiration.
