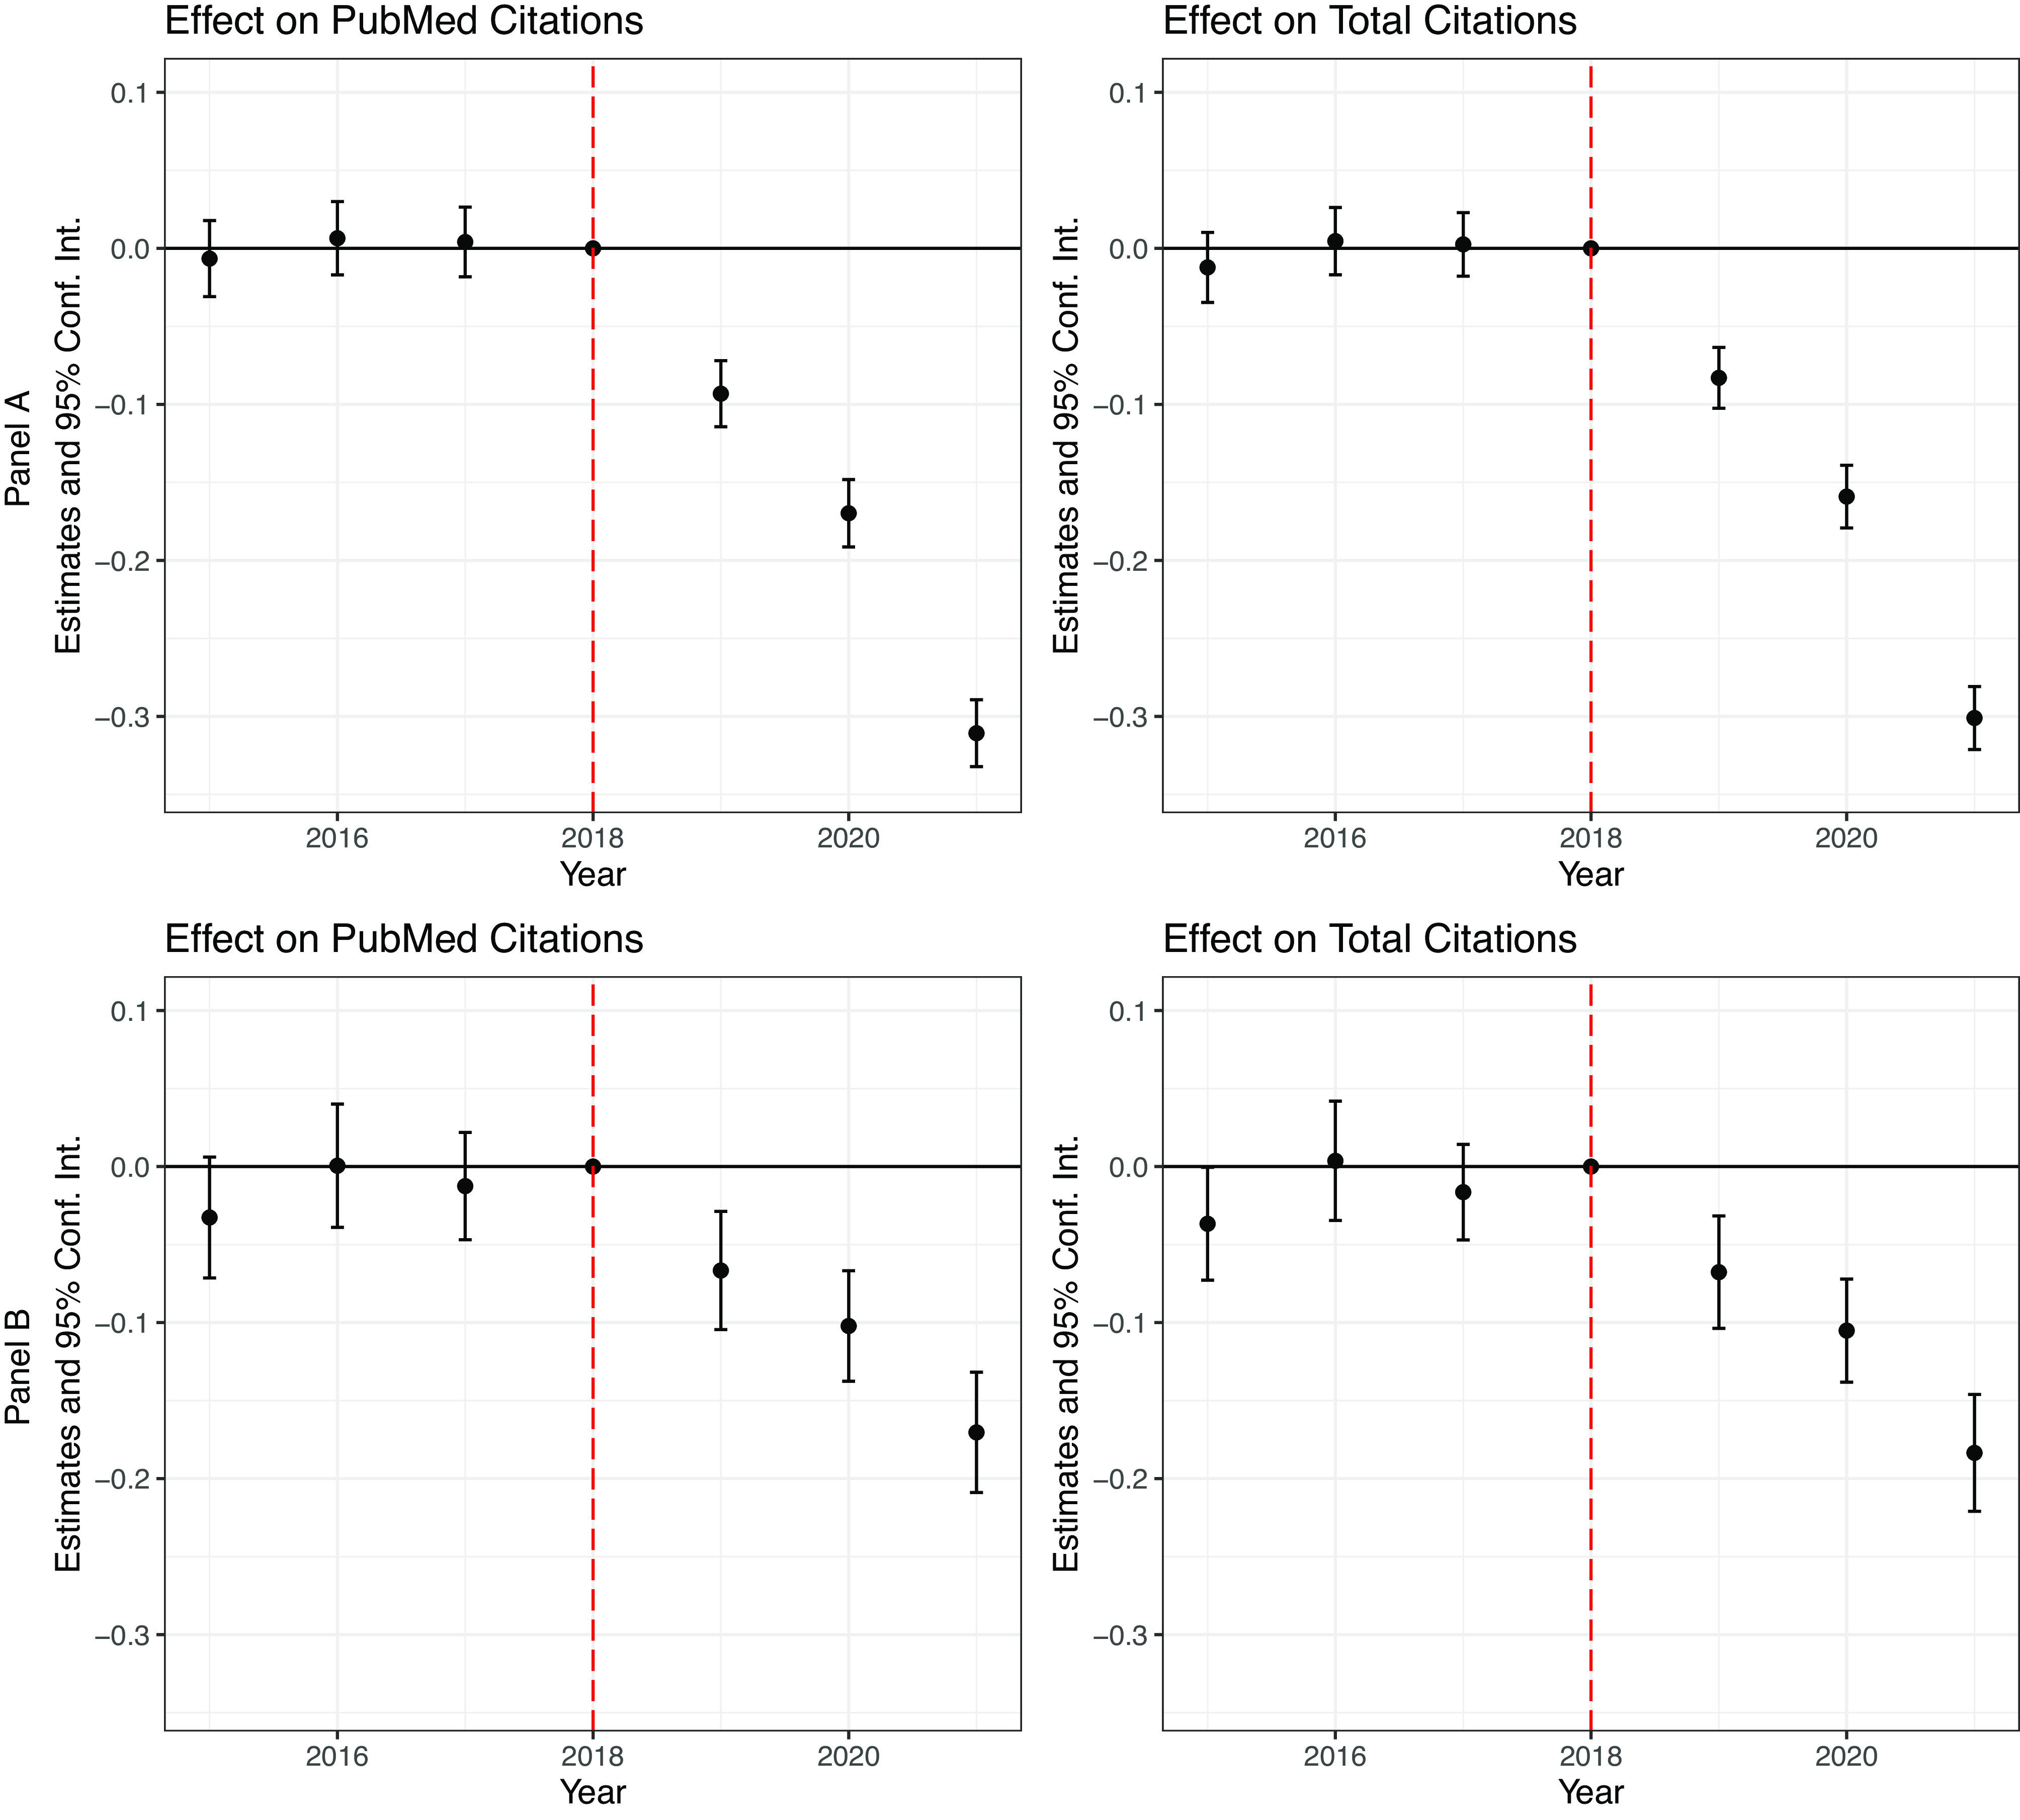
Fig. 3.

The impacts on productivity: results from event study. Note: Plots in this figure present the effect estimates of “leads and lags” of the treatment. Panel A presents the results controlling for scholar fixed effects and year fixed effects; Panel B presents the estimates using entropy balancing. Each segment represents the 95% CI of the estimate. The outcome in the left column is the logged number of citations for PubMed publications. In the right column, it is the logged number of citations for all publications.
