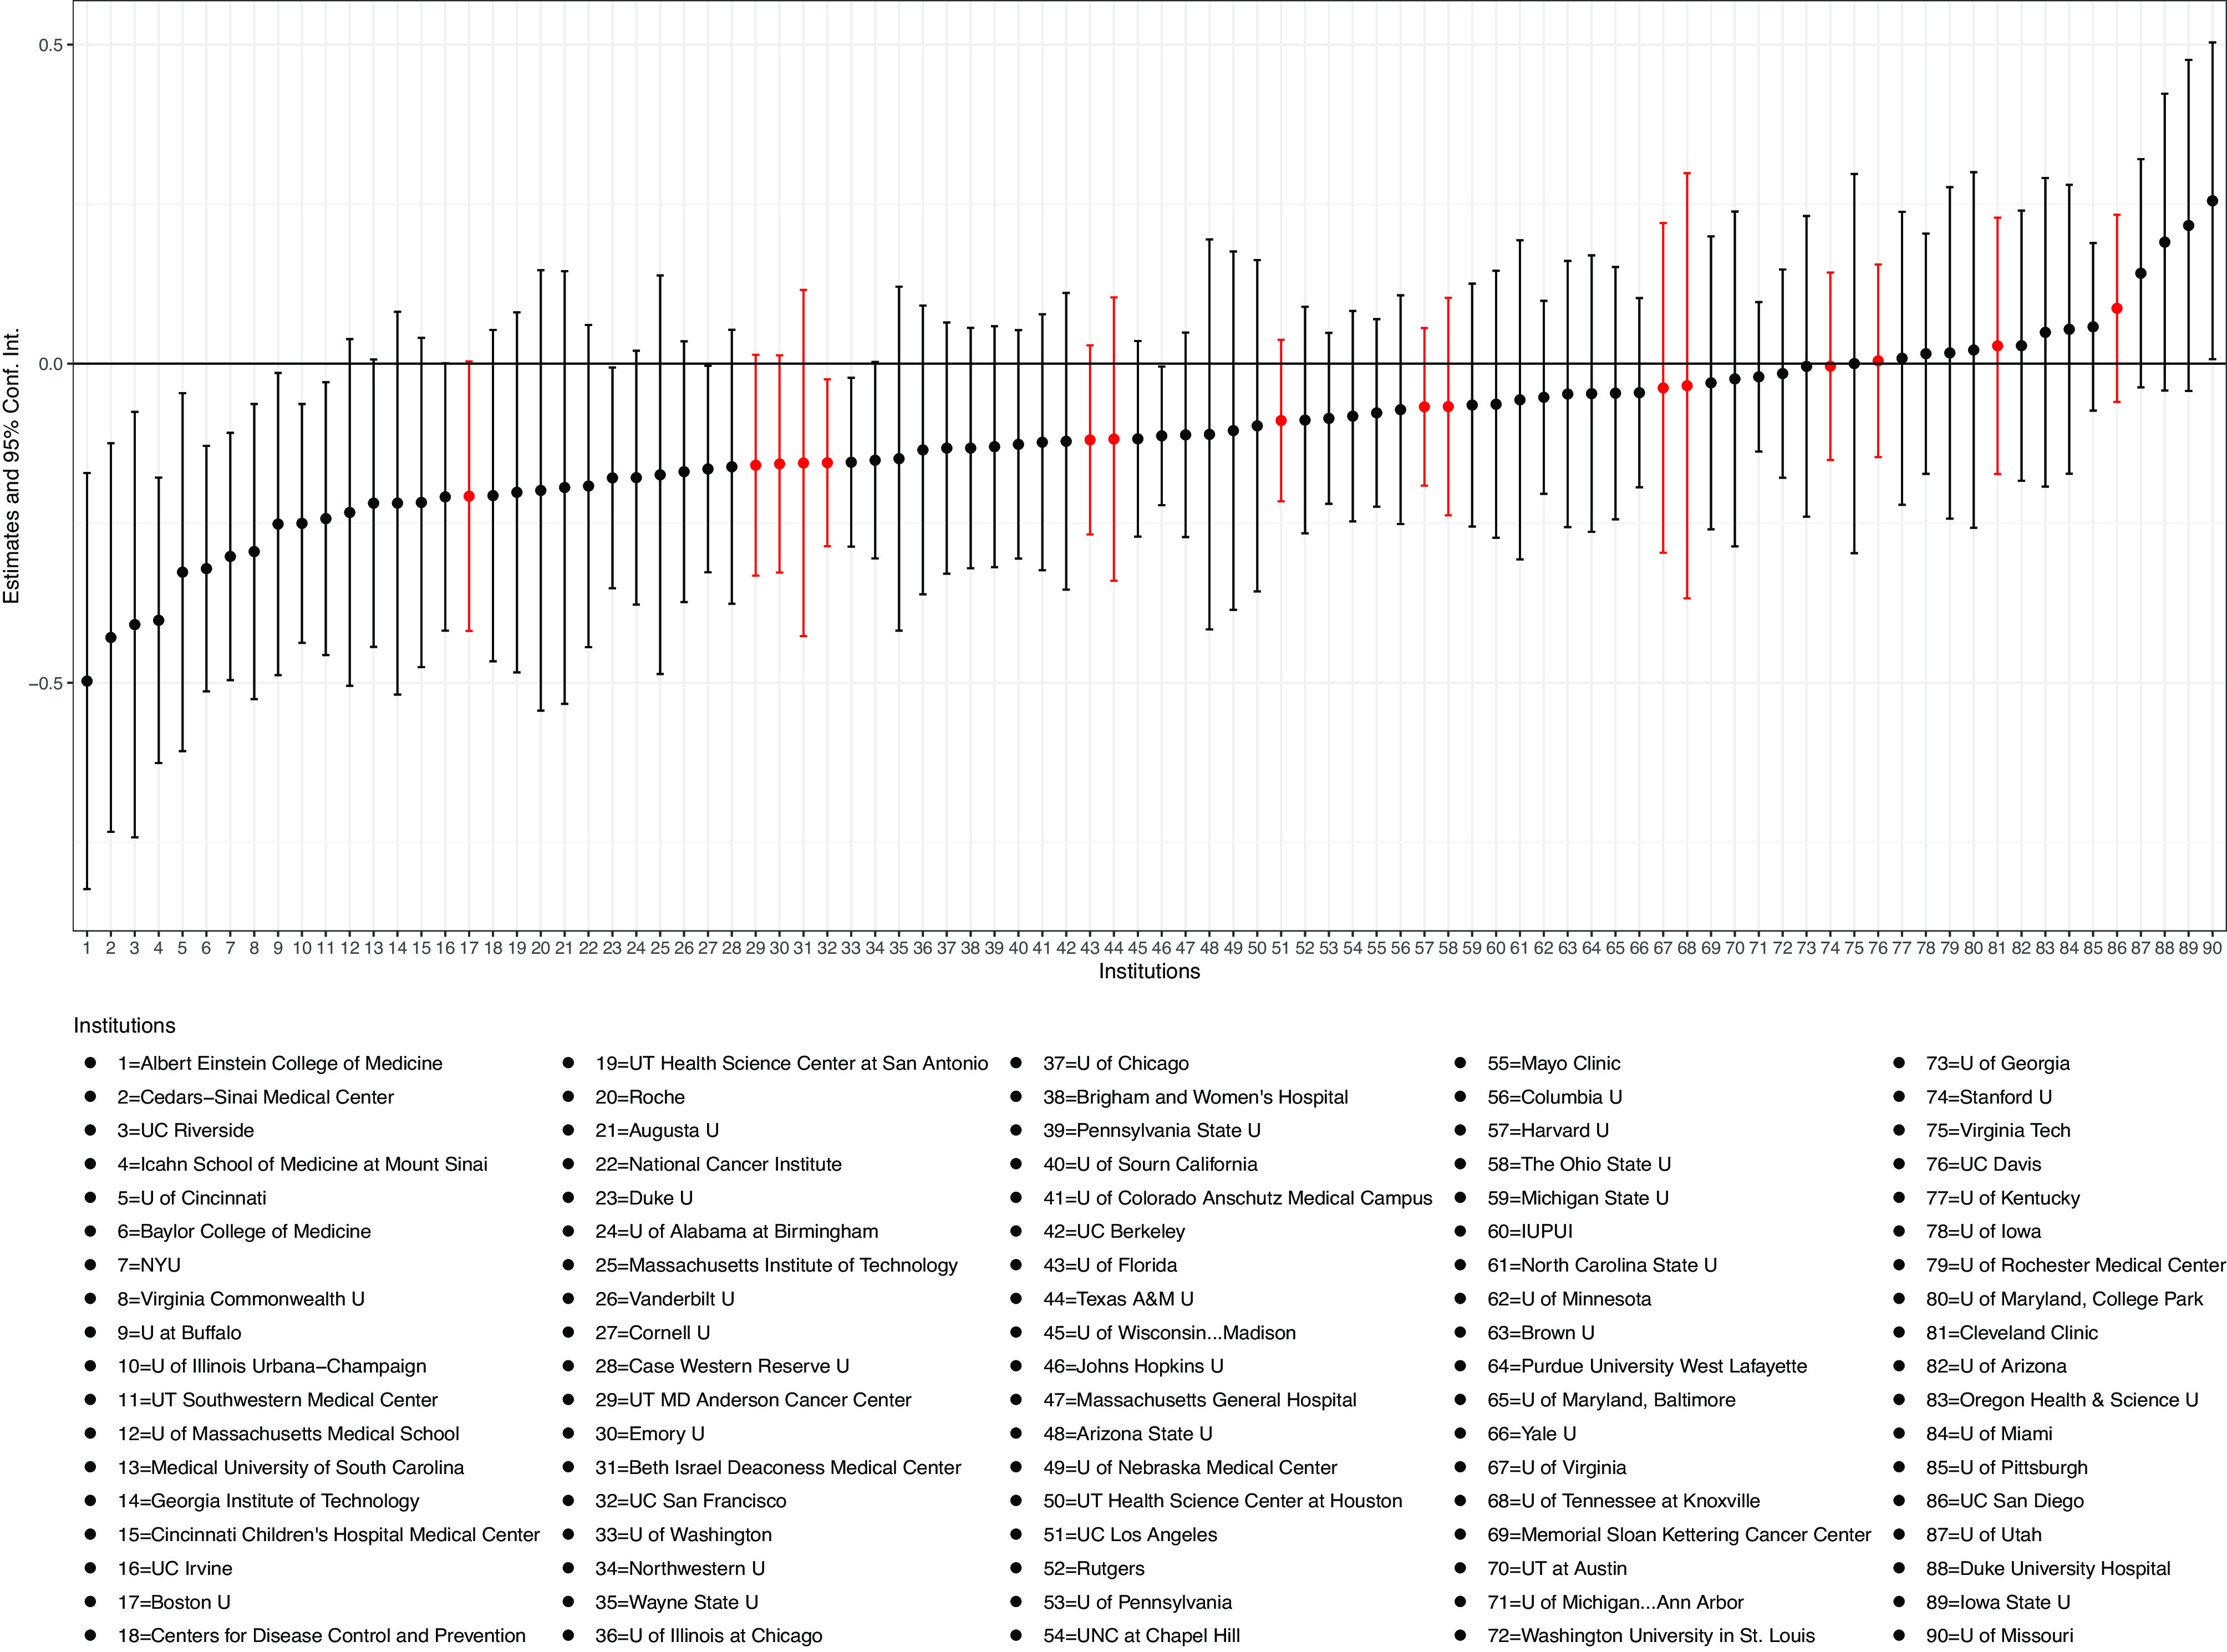
Fig. 4.

Heterogeneous treatment effects over institutions. Note: The figure presents the heterogeneity of treatment effects within the treated group across institutions in the sample that contain more than scholars in both the treated group and the control group. Each point and error bar represent the estimated effect at a given institution and the corresponding 95% CI. Those in red represent institutions that are known to have scientist(s) investigated by the NIH.
