Fig. 2.
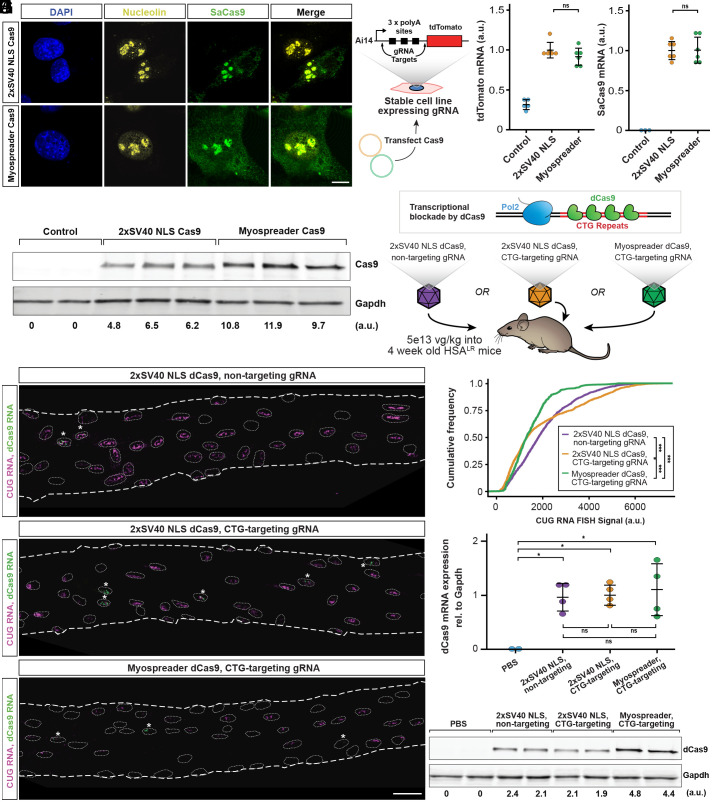
Myospreader improves stability and localization of Cas9/dCas9 in myoblasts and myofibers. (A) Representative IF images of C2C12 myoblasts transfected with plasmids encoding 2xSV40 Cas9 or Myospreader Cas9. SaCas9 is shown in green, nucleolin in yellow, and DAPI in blue. (Scale bars: 10 µm.) (B) Schematic of the experiment to assess Myospreader Cas9 stability and editing efficiency in C2C12 myoblasts. (C) tdTomato mRNA expression as assessed by RT-qPCR in AI14 reporter C2C12s following transfection with plasmids encoding 2xSV40 Cas9 or Myospreader Cas9. Plotted relative to the mean of the 2xSV40 NLS Cas9 group. Significance by Student’s t test. (D) Cas9 mRNA expression as assessed by RT-qPCR in AI14 reporter C2C12s following transfection with plasmids encoding 2xSV40 Cas9 or Myospreader Cas9. Plotted relative to the mean of the 2xSV40 NLS Cas9 group. Significance by Student’s t test. (E) Western blot against Cas9 and Gapdh in Ai14 reporter C2C12s following transfection with plasmids encoding 2xSV40 Cas9 or Myospreader Cas9. Relative signal intensity determined by densitometry at the bottom. A.U.: arbitrary unit, normalized to Gapdh. (F) Schematic of dCas9 impeding transcription of toxic CUG RNA and experiment. Each treatment was packaged in a single AAV vector systemically delivered to 4-wk-old HSALR mice at a dose of 5E+13 vg/kg. (G) HCR-FISH to detect CUG RNA foci (magenta) and dCas9 mRNA (green) in myonuclei of representative TA myofibers isolated from treated HSALR mice. Myonuclei borders are indicated with dashed lines. Asterisks indicate dCas9-positive myonuclei. (Scale bar: 30 µm.) (H) Cumulative distribution functions of HCR-FISH CUG RNA signal in myonuclei proximal to dCas9-expressing myonuclei in myofibers isolated from treated HSALR mice. Significance by Kolmogorov–Smirnov test. (I) dCas9 mRNA expression as assessed by RT-qPCR in gastrocnemius muscle of treated HSALR mice. Plotted relative to the mean of the 2xSV40 NLS Cas9 nontargeting group. Significance by Tukey’s HSD. (J) Western blot detecting dCas9 and Gapdh in gastrocnemius muscle of treated mice. Relative signal intensity determined by densitometry at the bottom. A.U.: arbitrary unit, normalized to Gapdh (ns = not significant; *P < 0.05; **P < 0.01; ***P < 0.001) (error bars = 95% CI).

