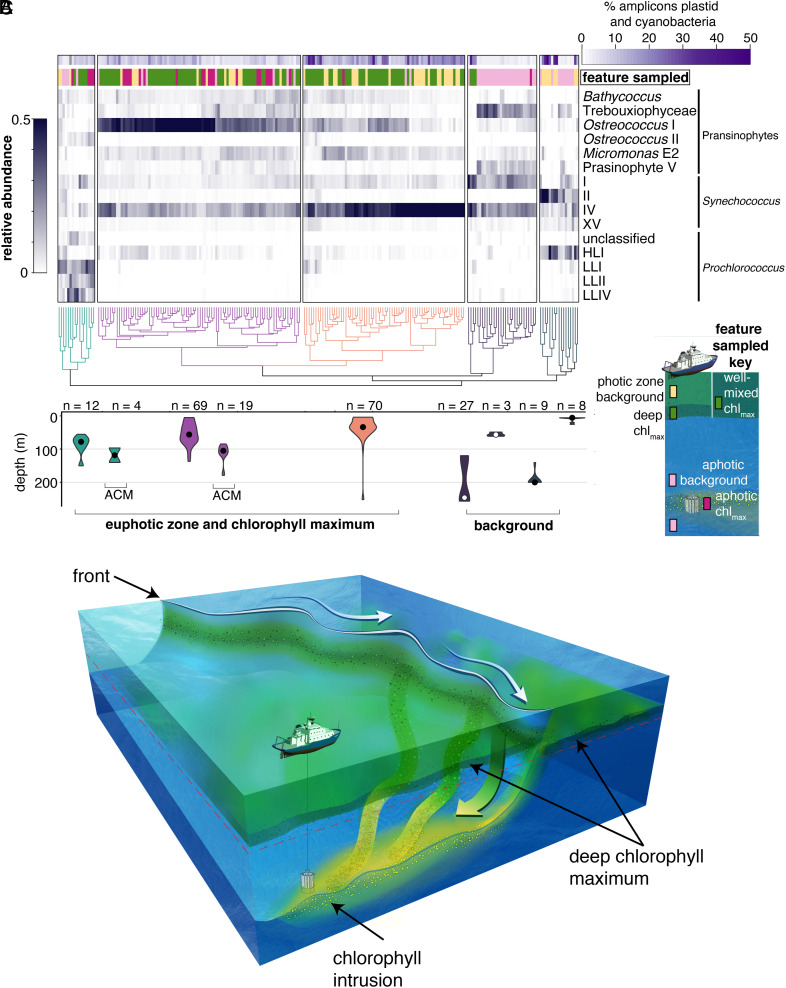
Fig. 2.
Surface ocean picophytoplankton communities are exported to the aphotic zone via intrusions. (A) Hierarchical clustering of picophytoplankton taxa identified using phylogenetic placement of V1–V2 16S rRNA gene ASVs (see SI Appendix, Fig. S8 for phytoplankton taxa of lesser relative abundance). Each colored cluster in the dendrogram is significant (P < 0.05). First, we tested the extent to which diversity had been saturated in our deep sequencing efforts; analysis of rare taxa was not undertaken due to lack of saturation in some samples (SI Appendix, Fig. S9). The top horizontal bar (purple) indicates the percentage of ASVs from cyanobacteria and photosynthetic eukaryotes out of the total number of amplicons, which includes sequences from heterotrophic bacteria; the two left-most clusters show extremely low percentages of sequences from phytoplankton, as expected of classical dark ocean samples. The second horizontal bar indicates the sampled feature type. The heat maps shows the relative abundance of each taxa. (B) Respective depth distribution of samples in selected clusters (shown by violin plots corresponding in color to clusters above) represented as the mean and distribution of samples (n indicates the number of samples). (C) Schematic of a frontal system with a deep chlorophyll maximum and an aphotic chlorophyll-containing intrusion. Intrusions are coherent, three-dimensional features with multiple origin locations along the front. Sampling occurred in transects capturing a cross-section of a three-dimensional system.

