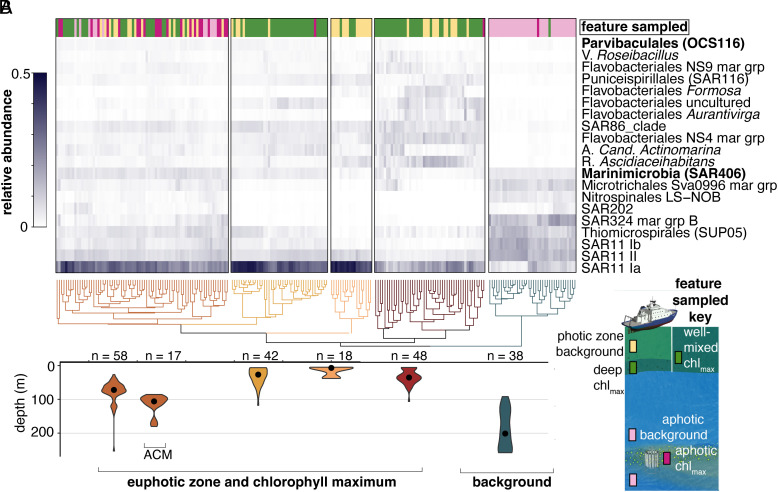
Fig. 4.
Specific nonphotosynthetic bacterial lineages appear to respond to intrusion conditions, reshaping community structure. (A) Hierarchical clustering of nonphotosynthetic bacterioplankton distributions with taxonomy determined using V1-V2 16S rRNA gene ASVs and established databases. The percentage contribution to total amplicons of the most relatively abundant taxa across all samples is shown in the heat map (grayscale). Bacterial taxa that were differentially more abundant in intrusions based on statistical analysis are denoted (bold lettering) and indicate enrichment in the ACM relative to the upper mesopelagic background and source photic-zone waters. The sampled feature is shown in the bar above the heatmap and is subtly different than that of picophytoplankton due to differences in hierarchical clusters influenced by enrichment of heterotrophs that appear to respond to the intrusion conditions. Each colored cluster is significant (P < 0.05). (B) Respective depth distribution of samples in selected clusters (shown by violin plots corresponding in color to clusters above) represented as the mean and distribution of samples (n indicates the number of samples). Nearly all ACM samples are in the same cluster and ACM samples are found deeper than other communities in this cluster.

