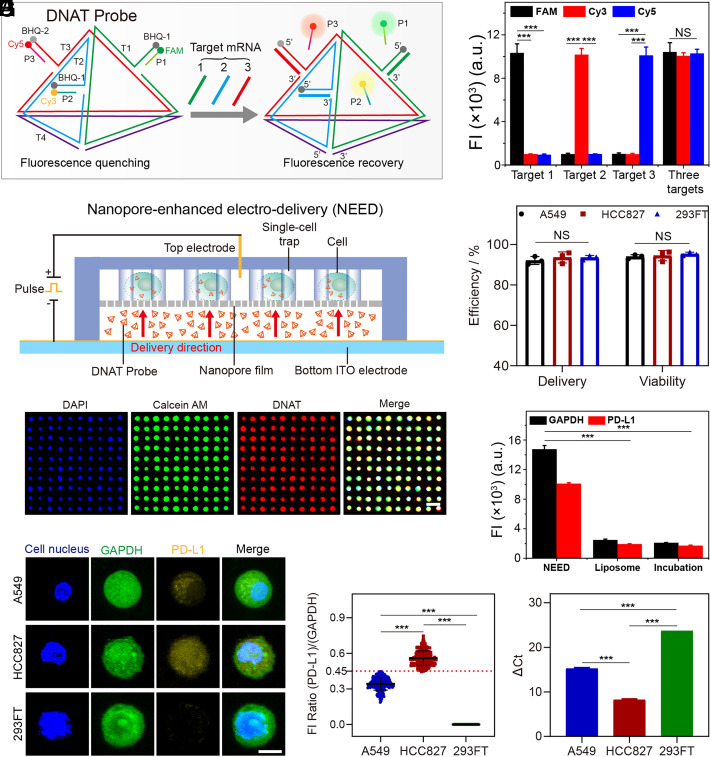
Fig. 2.
NICHE for quantifying target mRNA in living cells. (A) A schematic diagram of DNAT probes for detecting three target mRNA. T1, T2, T3, and T4 constitute the structural skeleton of the DNAT probe. The 5′ end of T1, T2, and T3 are partially complementary to P1, P2, and P3, respectively. Target 1, GAPDH mRNA. Target 2, PD-L1 mRNA. Target 3, CK mRNA. (B) The specificity of DNAT probes for detection of three target mRNAs. FAM, Cy3, and Cy5 represent the fluorescence signals from P1, P2, and P3, respectively. FI, fluorescent intensity. (C) A cross-sectional view of NEED for delivering DNAT probes into living CTCs. (D) The delivery efficiency of NEED and the viability of cells after probe delivery. DNAT probes labeled with FAM dye (without quencher) are delivered into cells for calculating the delivery efficiency. Propidium iodide (PI) dye is used to evaluate cell viability. The statistical data are obtained by counting 1,000 cells/chip from three independent assays. (E) Fluorescent characterization of probe delivery and cell viability on a compact single-cell trap array (the distance between the two cells is 10 μm). DAPI, blue dye for cell nucleus. Calcein AM, green dye, is used to evaluate cell viability. DNAT probe is labeled with Cy5 (without quencher). (Scale bar, 50 μm.) (F) Delivery dose of DNAT probes in HCC827 cells (10,000 cells) by NEED, liposome-based delivery, and simple incubation with free probe, using fluorescence intensity obtained via flow cytometry. (G) Fluorescent images of cells detected by DNAT probes. (Scale bar, 5 μm.) (H) Ratios of fluorescent intensity from 300 cells detected in three separated experiments. Error bars represent the SD. (I) Relative quantification of RNAs detected by qPCR. ΔCt is the difference between the Ct value of PD-L1 RNA and the Ct value of GAPDH RNA. The value of ΔCt is negatively correlated with target RNA concentration. PD-L1 is not expressed in 293FT cells, and the Ct value of PD-L1 is set at 40. ***P-value < 0.001. NS, no significant difference. Error bars in (B), (D), (F), and (I) represent the SD of three independent experiments.

