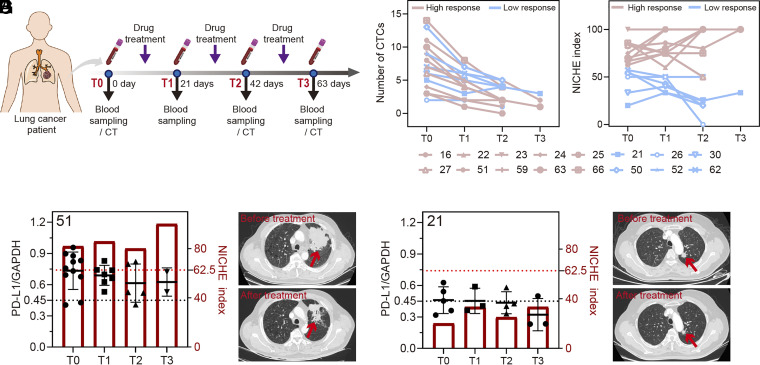
Fig. 5.
NICHE for monitoring NSCLC patients throughout drug treatment periods. (A) A schematic diagram of treatment process and sampling for monitoring cancer progression. (B) The CTC numbers isolated from blood samples of NSCLC patients at different drug treatment periods. T0, T1, T2, and T3 represent the period of treatment. High response, patients with the response evaluation of pCR and PR. Low response, patients with the response evaluation of MPR, MPR-, SD, and PD. (C) NICHE index determined based on blood samples of NSCLC patients at different drug treatment periods. (D) NICHE indexes and ratios of the fluorescent intensity of PD-L1 (Cy3 channel) and GAPDH (FAM channel) for each CTCs isolated from the blood samples of patient No. 51 (D). (E) The CT images of patient No. 51 before and after drug treatment. (F) presents the same data as (D) for patient No. 21, whilst (G) provides the CT images before and after drug treatment also for patient No. 21. The red arrows indicate tumor location.

