Fig. 3.
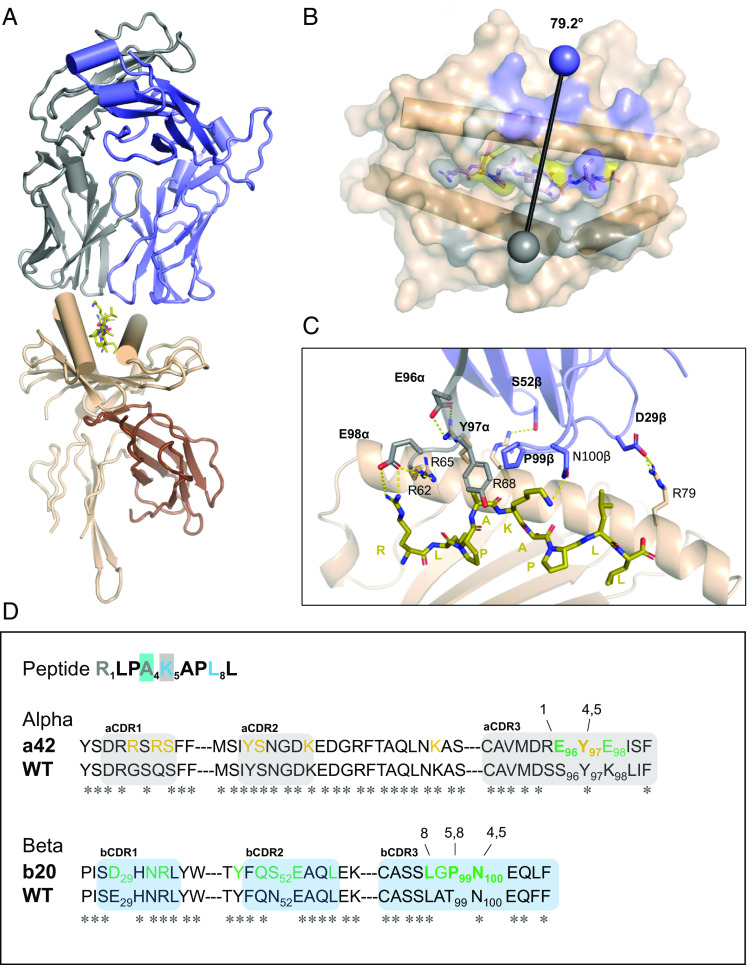
Structural overview of the affinity-enhanced a42b20 TCR in complex with HLA-E-inhA53-61 (A) Overall ribbon representation of TCR a42b20 in complex with HLA-E-inhA53-61; TCR alpha chain is colored gray, beta chain is blue, HLA chain is cream, the β2m is brown, and the peptide in olive stick representation. (B) Top–down view showing the pHLA surface; for orientation, HLA helices 1 and 2 are drawn as cylinders. pHLA surface is colored as in (A); residues that interact with the TCR alpha chain are colored gray, residues that interact with the TCR beta chain are in blue, and residues that interact with both the alpha and beta chains are in white. Gray and blue spheres show the position of the conserved disulfide bond in the alpha and beta variable domains, respectively; the vector joining them shows the crossing angle (79.2°). (C) Close-up view of the TCR-pHLA interface with residues introduced through affinity enhancement drawn as sticks and labeled in bold, hydrogen bonds and salt-bridges represented by yellow dashes. (D) TCR-pHLA interactions mapped onto sequence with truncated a42b20 and wild-type sequences provided to show sites modified by affinity enhancement. TCR alpha CDR loops are colored gray, whereas the beta CDR loops are colored blue. Peptide residues in gray or in blue font indicate that they are within 4.1 Å of TCR alpha chain or beta chain, respectively. Peptide residues 4 and 5 are highlighted in blue or in gray since they are also within 4.1 Å TCR of beta and alpha chain, respectively. TCR sequence annotation: positions in yellow or green font indicate that they are within 4.1 Å of HLA helix 2 or helix 1, respectively. Residues in bold indicate that they are within 4.1 Å of a peptide residue, with numbering above residues indicating the relevant peptide position/s.

