Fig. 1.
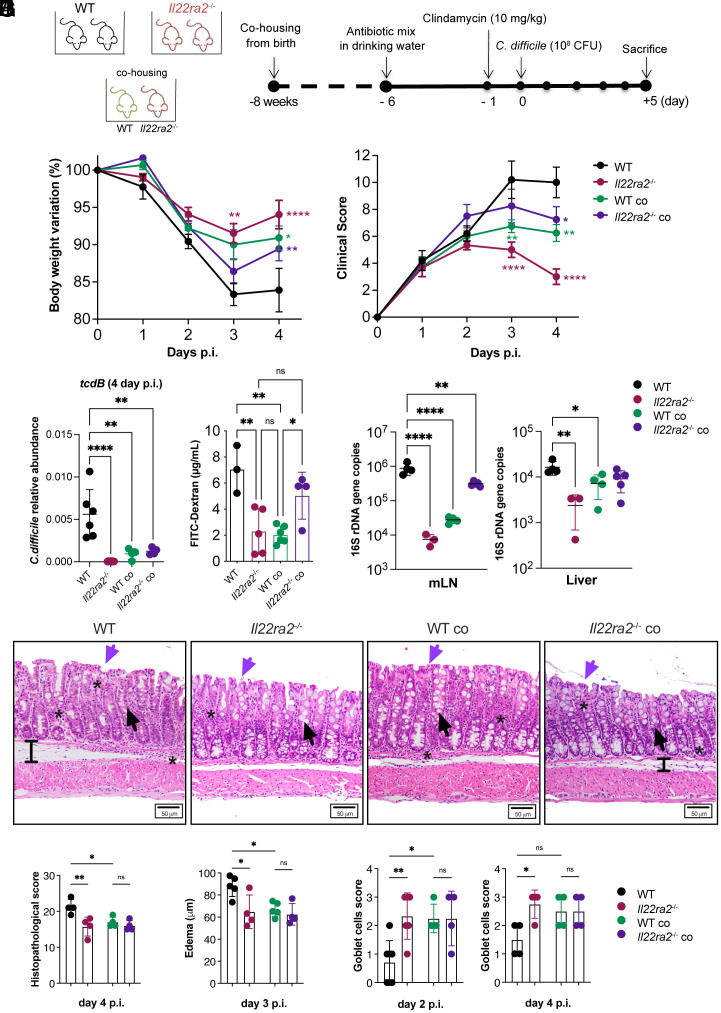
Il22ra2–/– mice provide protection to WT mice against C. difficile infection through cohousing. (A) Schematic representation of C. difficile infection model. Mice received a mixture of antibiotics in their drinking water for 4 d, followed by a single i.p. dose of clindamycin and subsequently were infected with 108 CFU of C. difficile. (B and C) Body weights (B) and clinical scores (C) during C. difficile infection were assessed in comparison to the WT non-cohoused group. The asterisks (*) indicate the statistical significance of the same color group they refer to when compared to the control. (D) Abundance of C. difficile in the feces of infected mice on day 4 p.i. The abundance was calculated by qPCR of the tcdb gene expressed by C. difficile normalized based on the 16S rDNA gene. (E) Intestinal permeability measured by serum FITC-Dextran. (F) Quantification of bacterial 16S rDNA gene copies in mesenteric lymph nodes (mLN) (Left) and liver (Right) on day 4 p.i., normalized by 16S rDNA of E. coli. (G) Representative H&E images of the mid colon of WT and Il22ra2–/– mice reared under different housing conditions on day 4 p.i. (Scale bar, 50 µm.) Black arrows indicate goblet cells; purple arrows indicate epithelial cell damage; black bars show edema; and stars point to areas of immune cell accumulation. (H) Histopathological scoring of colonic sections on day 4 p.i. The total score ranges from 0 to 30 and was calculated as the sum of 10 parameters, each quantified on a scale from 0 (normal) to 3 (severe) as indicated in SI Appendix, Table S2. (I) Submucosa edema on day 3 p.i. Edema was defined as the space between the muscularis mucosae and muscularis externa. The mean value of 20 distinct areas from each mouse is plotted as µm. (J) Goblet cell density defined using the scoring criteria indicated in SI Appendix, Table S3 on day 2 (Left) and 4 (Right) p.i. (A–F) n = 4 to 6; (G–J) n = 4 to 7 mice per group. (B–F) One representative experiment is shown. Data for the second experiment are reported in Dataset S3. Error bars represent mean ± SD. Normality was assessed with D’Agostino–Pearson test; statistical analysis was performed using One-way ANOVA with post hoc Tukey test. *P < 0.05; **P < 0.01; ***P < 0.001; ****P < 0.0001; ns = not significant.

