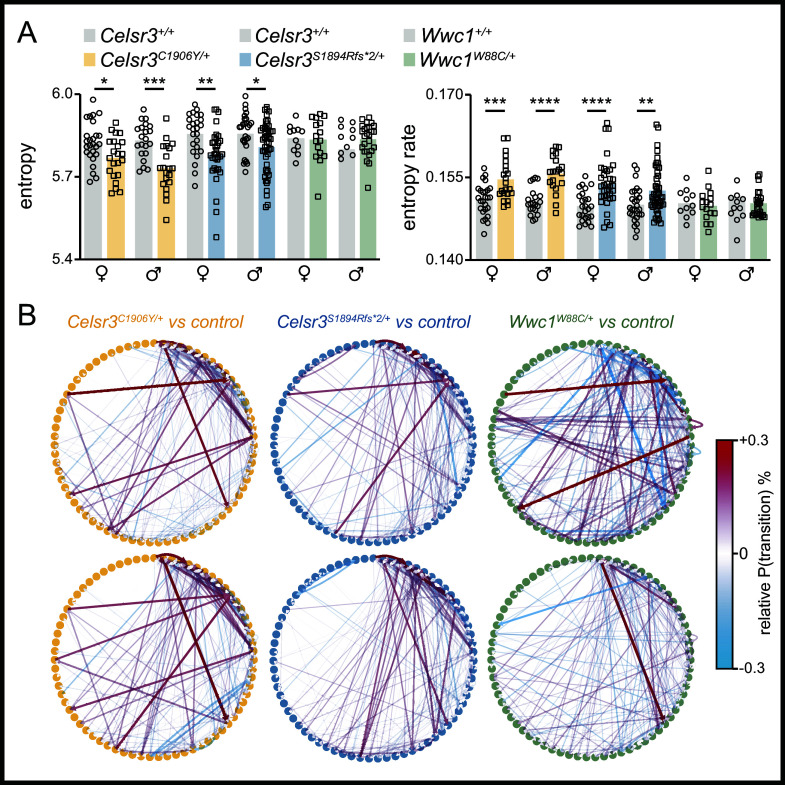
Fig. 5.
Motion sequencing shows common changes to behavioral structures in mutant mice. (A) Left, entropy graph. Right, entropy rate graph. (B) State maps showing transition probability changes in mutants relative to wild-type mice. Circles represent syllables, lines represent transitions with red lines showing a higher relative transition probability and blue lines showing a lower relative transition probability. Celsr3C1906Y/+ females (Top Left, Celsr3+/+ n = 26, Celsr3C1906Y/+ n = 22) and males (Bottom Left, Celsr3+/+ n = 21, Celsr3C1906Y/+ n = 20). Celsr3S1894Rfs*2/+, females (Top Middle, Celsr3+/+ n = 25, Celsr3S1894Rfs*2/+ n = 33) and males (Bottom Middle, Celsr3+/+ n = 28, Celsr3S1894Rfs*2/+ n = 48). Wwc1W88C/+ females (Top Right, Wwc1+/+ n = 11, Wwc1W88C/+ n = 16), and males (Bottom Right, Wwc1+/+ n = 12, Wwc1W88C/+ n = 26).

