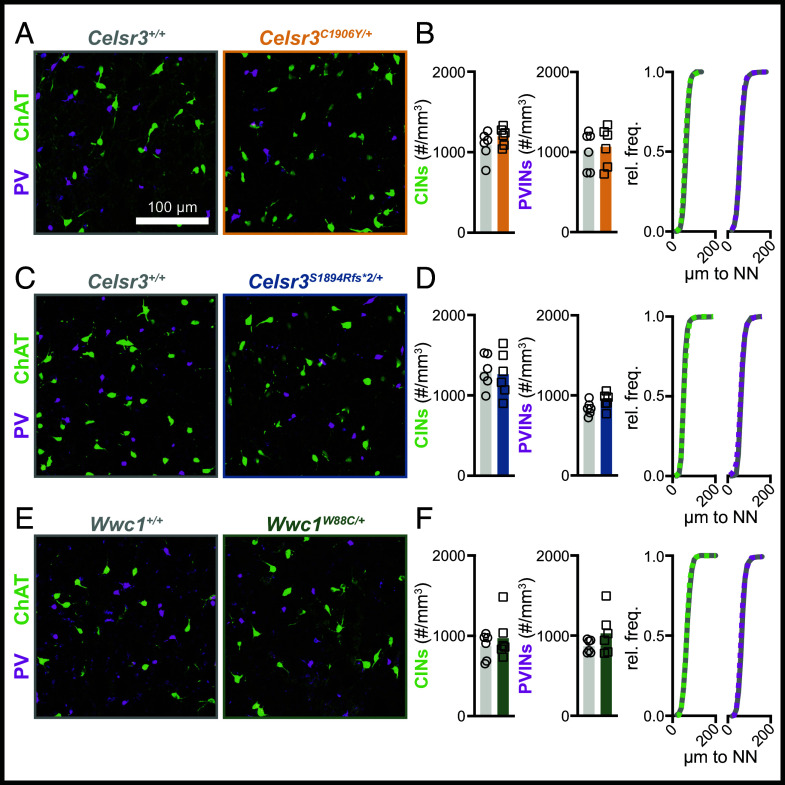
Fig. 7.
Striatal cholinergic and parvalbumin-expressing interneuron density is normal in Celsr3 and Wwc1 mutant mice. (A) Representative images showing striatal CINs (ChAT+, green) and PVINs (PV+, magenta) in Celsr3C1906Y/+ mice and littermate controls. (B) Quantification of CIN (Left, P = 0.2220) and PVIN density (Middle, P = 0.7735) in Celsr3+/+ (n = 6) and Celsr3C1906Y/+ (n = 6) mice, and cumulative frequency distribution of nearest neighbor (NN) distance of CINs and PVINs (right, Celsr3+/+: solid curve, Celsr3C1906Y/+: dashed curve). (C) Representative images showing striatal CINs (ChAT+, green) and PVINs (PV+, magenta) in Celsr3S1894Rfs*2/+ mice and littermate controls. (D) Quantification of CIN (left, P = 0.8090) and PVIN (Middle, P = 0.1000) density in Celsr3+/+ (n = 6) and Celsr3S1894Rfs*2/+ (n = 6) mice, and cumulative frequency distribution of NN distance of CINs and PVINs (Right, Celsr3+/+: solid curve, Celsr3S1894Rfs*2/+: dashed curve). (E) Representative images showing striatal CINs (ChAT+, green) and PVINs (PV+, magenta) in Wwc1W88C/+ mice and littermate controls. (F) Quantification of CIN (Left, P = 0.4579) and PVIN (Middle, P = 0.2077) density in Wwc1+/+ (n = 6) and Wwc1W88C/+ (n = 6) mice, and cumulative frequency distribution of NN distance of CINs and PVINs (right, Wwc1+/+: solid curve, Wwc1W88C/+: dashed curve). All statistical comparisons were made using Welch’s t tests.

