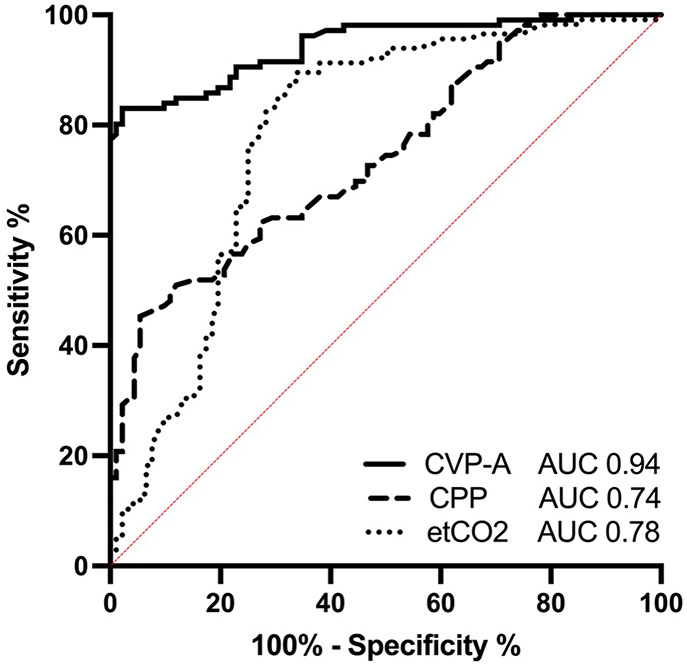
Figure 3. Receiver Operating Characteristic Curves.
ROC curves evaluating the ability of end-tidal CO2 (etCO2), coronary perfusion pressure (CPP) and central venous pressure amplitude (CVP-A) to discriminate between ROSC and NO ROSC after 3 min of CPR and defibrillation. Area under the curve (AUC) of CVP-A: 0.94, 95% CI: (0.86, 1.00); CPP: 0.74, 95% CI: (0.54, 0.95); etCO2: 0.78, 95% CI: (0.50, 1.00).

