
Fig. 4.
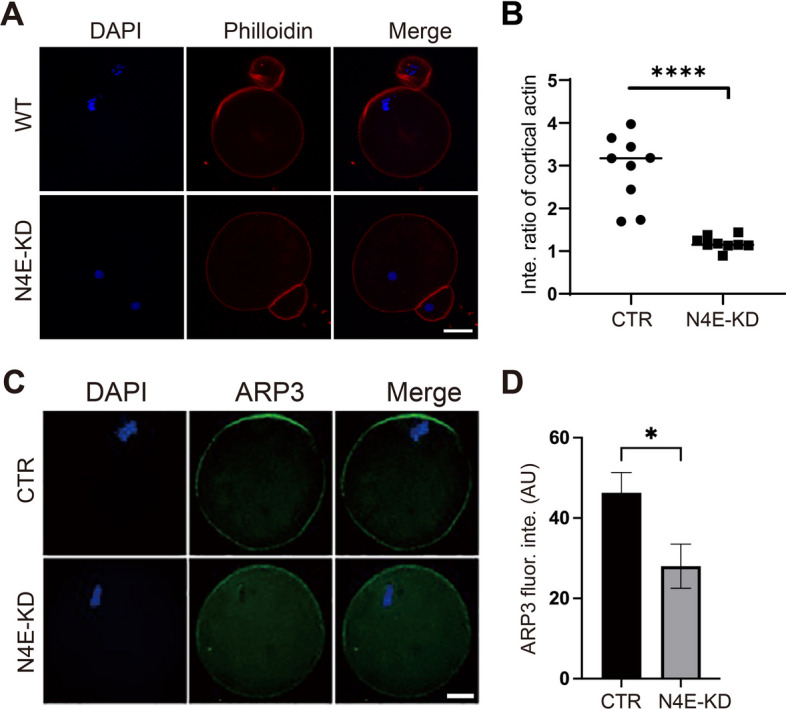
NLRP4E knockdown disrupted actin cap formation. A, B Phalloidin staining and quantification show that NLRP4E knockdown caused a significant decrease in the intensity of actin filaments at the cap region. DNA is shown in blue, and phalloidin in red. C, D Immunofluorescence analysis shows that NLRP4E knockdown caused a significant decrease in the intensity of ARP3 at the cap region. DNA is shown in blue and ARP3 in green. Scale bar, 20 μm. * indicates p < 0.05; **** indicates p < 0.0001