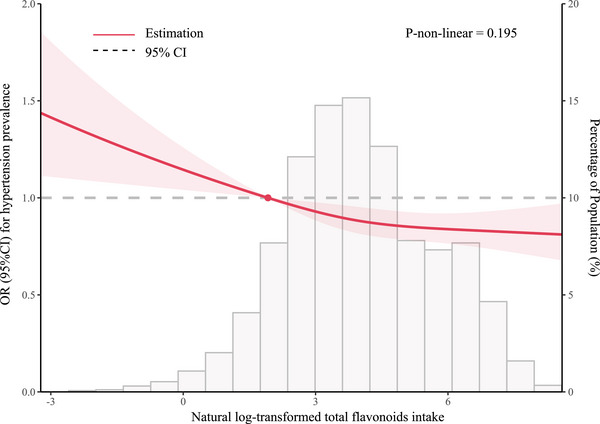
FIGURE 2.

Restricted cubic spline analyses of the association of flavonoid intake (natural log transformation) with hypertension. Heavy central lines represent the estimated adjusted hazard ratios. The 95% confidence interval is represented by the red band. The adjustment strategy is the same as the Model 2.
