FIGURE 4.

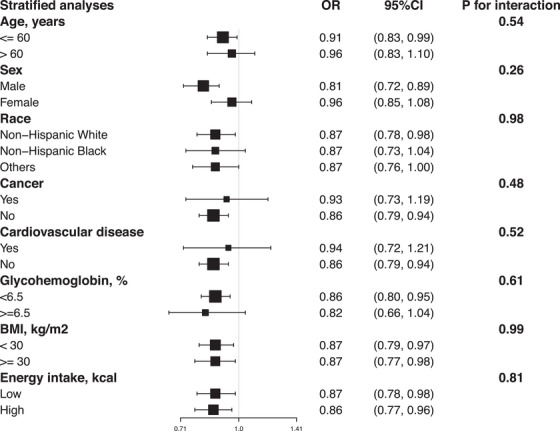
Forest plots of stratified analyses of total flavonoid intake (natural log transformation) and the risk of hypertension. With the exception of the variable itself, the adjustment approach is the same as Model 2.

Forest plots of stratified analyses of total flavonoid intake (natural log transformation) and the risk of hypertension. With the exception of the variable itself, the adjustment approach is the same as Model 2.