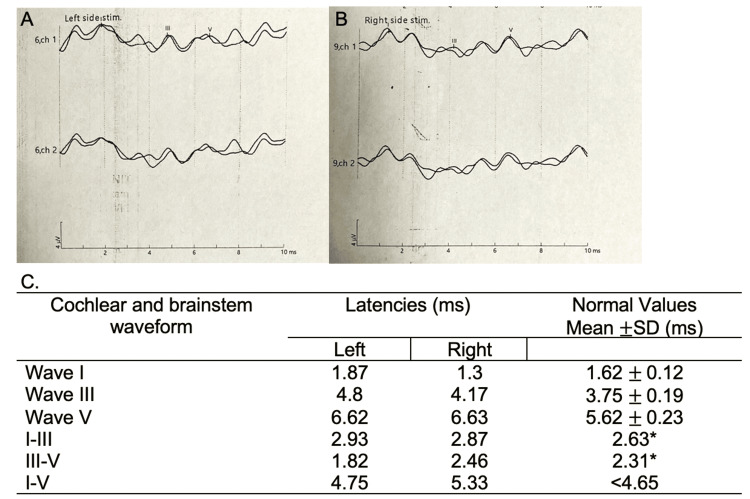
Figure 1. Brainstem auditory evoked response done on day 10 of illness.
A: waveform from the left ear; B: waveform from the right ear; C: cochlear and brainstem waveform latencies in milliseconds (ms)
*Upper limit normal
Normal values based on St. Luke's Medical Center Global City Institute of Neurosciences laboratory reference range
Stimulation of both ears individually using click stimulus polarity at 90 dB evoked well-defined cochlear and brainstem waveforms I, III, and V, both ipsilaterally and contralaterally with bilateral ear stimulation

