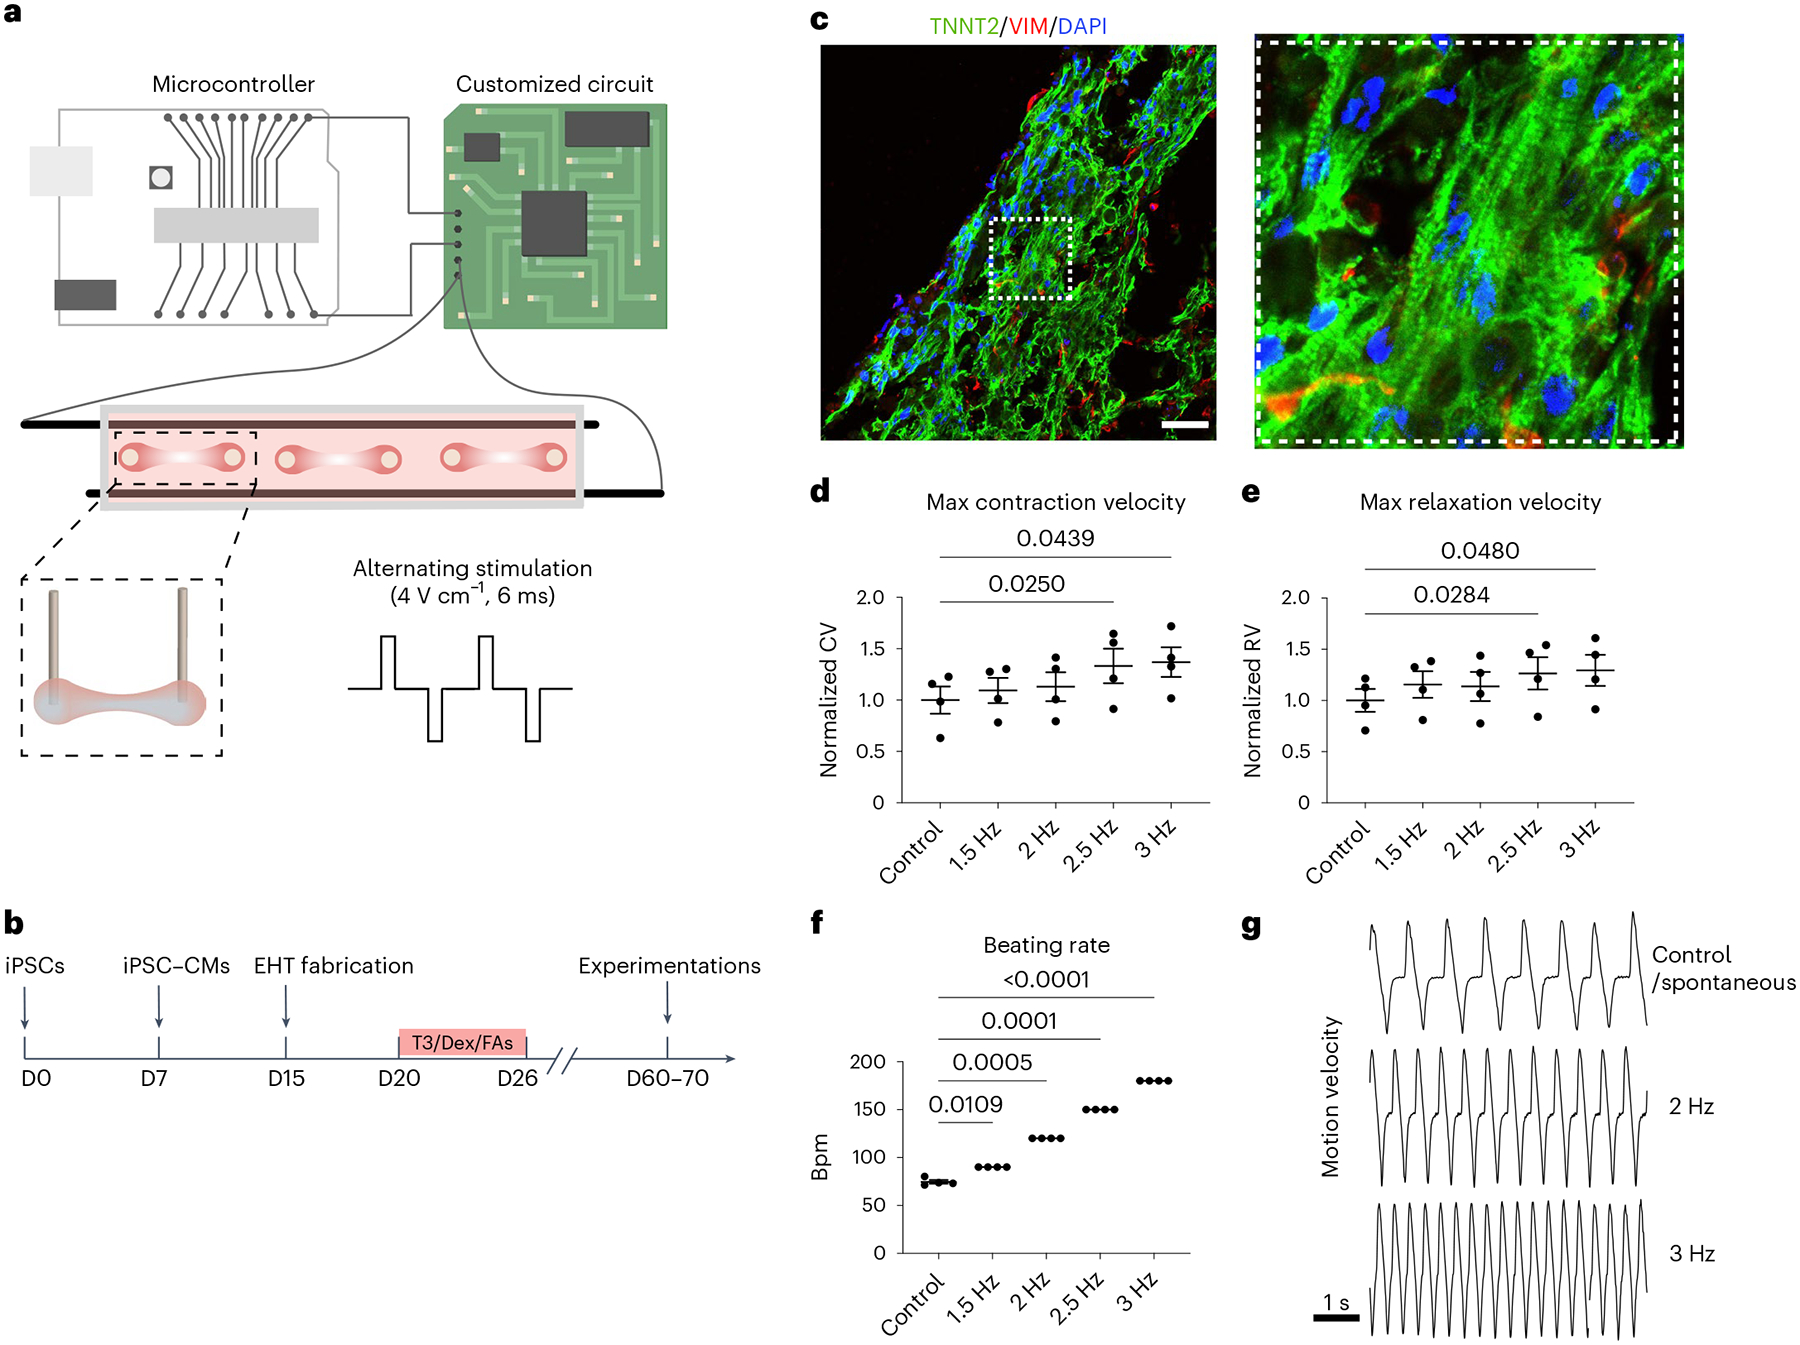
Fig. 3 |. Validation of the EHT tachypacing setup.

a, Schematic illustration of the customized pacing setup consisting of a microcontroller, a custom-built circuit and a culture chamber for EHTs. The direction of the stimulation current was altered after each pulse (4 V cm−1 and 6 ms pulse width). Parts of the illustration were created with BioRender. b, EHTs were generated from human iPSCs, matured with a combination of T3, Dex and fatty acids (FAs) supplementation and cultured until day (D) 60–70 for subsequent experimentations. c, Confocal images of an EHT cross-section immunostained for TNNT2 shown in green, and Vim shown in red; cell nuclei were stained by 4,6-diamidino-2-phenylindole (DAPI) shown in blue. Scale bar, 200 μm. d,e, High-speed videos of the beating EHTs from iPSC line SCVI-273 were taken to calculate maximum (max) contraction velocity (CV) (d) and maximum relaxation velocity (RV) (e) while the EHTs were subjected to an increasing stimulation frequency. For d and e, data were normalized against the unpaced control EHTs. f, The beating rate of the EHTs in response to electrical stimulation with an increasing frequency. g, Representative motion velocity traces of EHTs measured during spontaneous beating (control), 2 Hz pacing and 3 Hz pacing. n = 4 EHTs per group. One-way ANOVA with Dunnett’s multiple comparisons test. Data are displayed as mean ± s.e.m.
